Although there are many electric vehicle (EV) charging stations, it does not mean that the utilization of those stations can be taken for granted. Various cities witness similar figures in terms of the number of charging stations and number of people using them. However, this situation cannot be attributed to any particular number of users alone.
The factors that have been acknowledged in typical models for the selection of sites include the average number of vehicles, population density, connectivity of road networks, and the volume of customer traffic in retail locations. Even though these factors could be treated as crucial factors, they do not address all the issues connected with the demand for public charging service; how long the driver is at the site; how well equipped the site is; and if there is an electric line in the chosen location that is able to satisfy the increased demand that would result from setting up a charging station.
EV Charging Station Site Selection process has turned its focus to more efficient operation rather than the coverage. It is not only about the location that is frequently used, but also the one that allows for the use of the station depending on the need for charging, waiting time, type of users, capacity of the grid, and reliability of its work.
Why High Traffic Does Not Always Mean High Charging Demand
The number of vehicles passing through the place is sometimes considered proof of demand for charging facilities. However, a busy roadway doesn’t mean its users actually require charging. The road can be full of electric automobiles, yet if a good charging network is not available, these electric vehicles are unlikely to spend long time at the charging station. At the same time, a location with fewer cars may be characterized by a big number of households and yet stable demand in charging services.
When deciding on the required numbers of vehicles, it is as critical to discover how many drivers expect to stop, charge, and wait long enough to recharge their vehicle at the said station.
What is crucial in connecting service capability to holding time? For example, the charge zones with a length of stay of six hours may require using Level 2 charging, while the ridesharing stations may benefit from using DC fast charging procedures for ensuring quick throughput of automobiles. In certain instances, installing charging equipment at one location may restrict the usage of the charging station even in that very location that would be good for the charging station.
Accessibility matters too. Tough corners, bad signage, small roadways, and hard parking can all limit effective demand. Traffic counts should be thought of as a consideration and not a result.
Use of the port: The duration (in %) of usage or energy supply at a single charging port.
The Data Signals That Actually Predict EV Charging Utilization
The data from numerous sets indicates noticeable areas of high utilization. Presence of parked electric vehicles reveals that there is not enough options for the drivers, and demand varies.
| Data signal |
What it reveals |
Why it matters |
| EV registrations and vehicle mix |
Local EV concentration, battery size and charging capability |
Separates general population growth from addressable charging demand |
| Origin-destination and mobility data |
Where trips begin, end and cluster |
Identifies recurring travel corridors and activity zones |
| Parking dwell time |
How long vehicles remain stationary |
Helps match Level 2, mid-power DC or high-power DC charging |
| Home-charging availability |
Share of drivers without garages, driveways or assigned parking |
Reveals recurring dependence on public charging |
| Existing charging sessions |
Session frequency, energy delivered, peak occupancy and repeat use |
Shows actual behavior rather than theoretical demand |
| Temporal demand patterns |
Hourly, weekday, weekend and seasonal variation |
Prevents averages from hiding congestion or underuse |
There are some models which include stationary variables such as kind of land use, type of real estate and availability of parking, but also dynamic variables such as the number of gadgets being charged, duration of queue and so on.
Temporal granularity is of vital importance. A location is considered well-used in terms of average daily utilization even if its highest traffic occurs only from 17.00 to 20.00. There may be crowds on that location during the weekdays, but weekends are quieter, and this will definitely influence the revenue, level of service provision and number of places available.
The operators must also understand the difference between manifest and latent demand. For example, low charging activity may mean that the infrastructure is not reliable, but it does not mean the demand is absent. There are many indicators of manifest demand, including density of apartments, ownership of electric vehicles (EVs), detours to charging points, and queues at nearby chargers.
Machine learning is how site ratings are defined, but it is essential to maintain the human aspect of the interpretation of such ratings. The planners should comprehend all reasons for getting a particular rating and all factors which influence the process of rating, as well as those assumptions that create the difference between the original prediction and the resulting one.
In temporal analysis, temporal granularity refers to the frequency of an event in a specific time period such as hourly, daily, or seasonal.
Follow the Home-Charging Gap: Apartments, Renters and Curbside Demand
The decisions concerning the use of public charging points are dependent on whether or not the vehicle owner has access to home charging solutions. People having garages can charge their electric cars at home and would hardly utilize public charging facilities. On the contrary, those living in apartments, older cities or rental properties will need to resort to public charging points weekly.
The problem of charging at home gives rise to the same market demand which can persist for a longer time period than daytime traffic. Indicators of significance include the number of renters, density of multi-family dwellings, parking lots and the ratio of people per parking space and distance to the next secure charging point.
The local parking behavior indicates that cities should explore curbside charging as an option, as it provides new services to people without a garage or driveway. However, it is important to take into account aspects such as cabling, parking rule enforcement, accessibility, snow removal, security concerns, utility services, and the connection with loading zones when implementing curbside charging.
It should not be taken for granted that occupants of apartment buildings require fast charging for cars. In instances where automobiles remain parked for extended periods overnight, using controlled level 2 chargers may yield savings on infrastructure and help power the electric grid. In cases where parking spots are not guaranteed or where cars are in constant motion charging units that can be used by multiple residents may be a workable solution.
The potential for the expansion of electric vehicle (EV) utilization exists in locations with limited private charging but may not be perceived as attractive according to traditional traffic models.
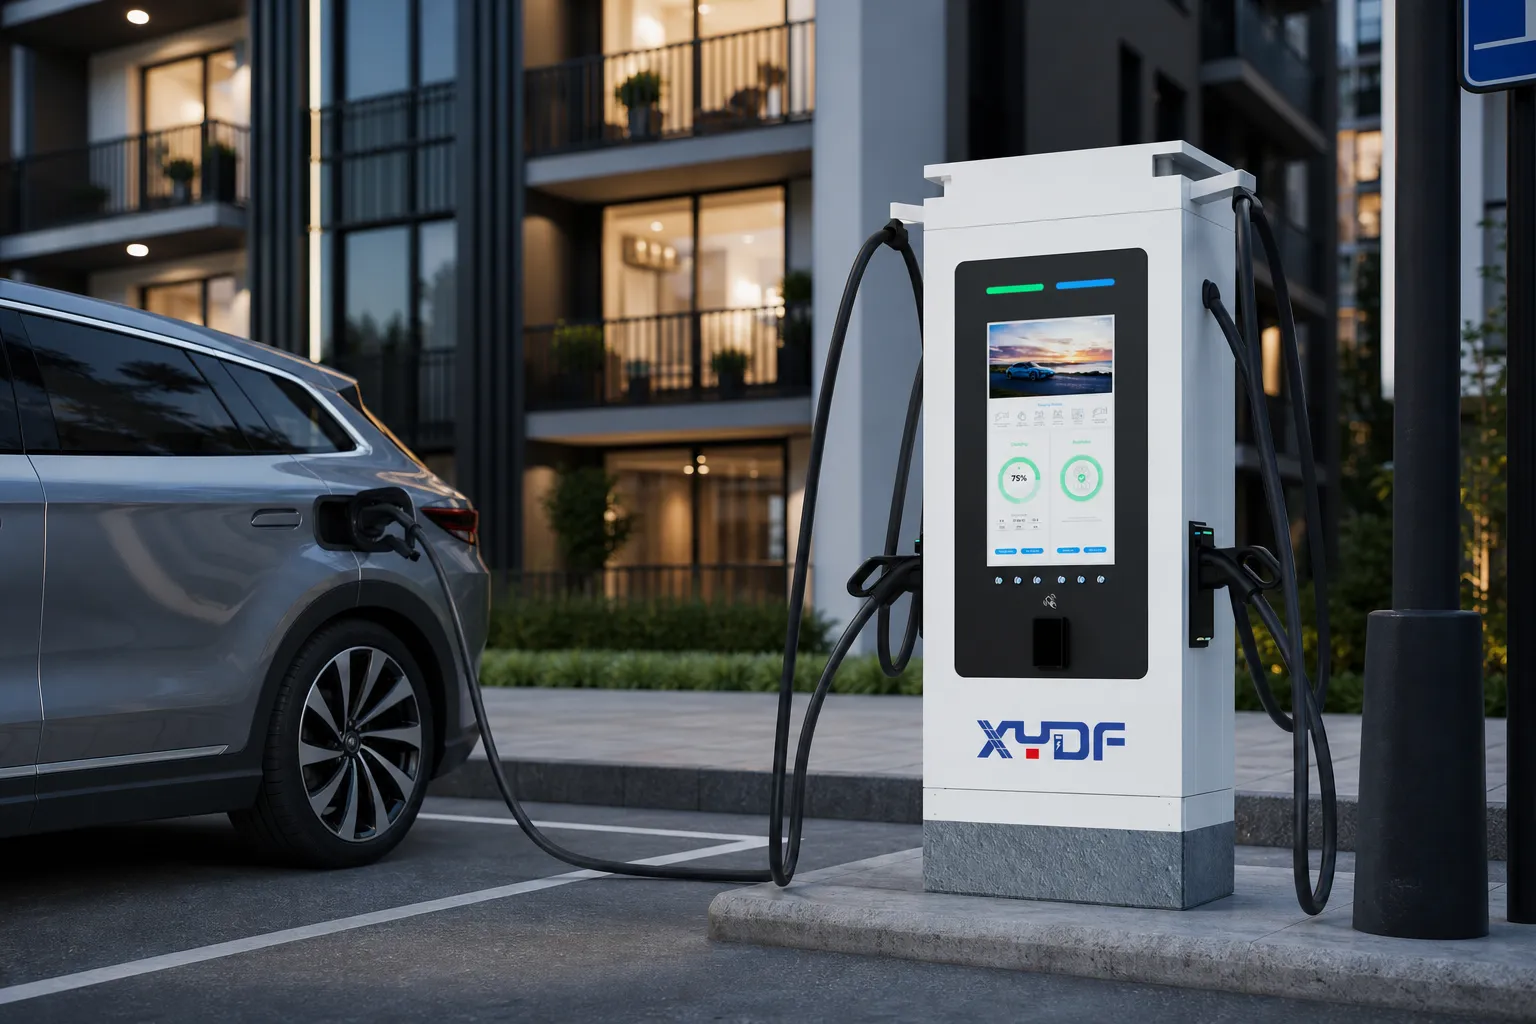
Rideshare, Delivery and Robotaxi Hubs: The Next High-Throughput Charging Sites
In terms of the demand for private cars as compared to that for fleets such as ride-hailing services, taxis, couriers, robotaxis etc., the difference is staggering. Indeed, private vehicles travel further, stop at numerous charging stations, and do not provide profit while idle.
In this segment, site selection needs to play a crucial role in decreasing the incidence of deadhead mileage and idle time. A charging station, even if it is in a popular location, can be ineffective due to traffic problems in the area or paralysis in predicting the duration of waiting queues.
Fleet operations websites are normally situated near airports, business areas, and logistics centers, but not on major thoroughfares like highways. The location must allow the vehicles to come to the site, recharge their batteries, and leave fast.
The operational design is vital for the site selection process. There should be a good traffic pattern in the terminal facilities, and there should be ample space for queuing and charging. The layout of the site is to be adapted for trucks or other types of big vehicles.
Robotaxis significantly improve infrastructure. This means that there will be a need for a charging station at which an autonomous fleet can undertake its procedures, and therefore there will be an integrated depot functioning rather than a regular public place of operation.
To reduce the hazards of concentration, it is possible to mitigate risks by offering some ports for use and maintaining part of the capacity for the vessels available under contract.
Pull-Through Layout:Pull-Through Layout is a design for a parking space that enables vehicles to enter and exit without reversing.
Demand Stacking: How Mixed-Use Sites Create All-Day Utilization
Most railway stations experience heavy traffic only at a particular time of the day, while the other times have small traffic. Demand stacking is a technique that helps improve resource use by consolidating different customers with different schedules.
An area that serves several purposes may offer workplaces for staff during the daytime and spaces for visitors for eating and exercising in the evening. The goal is to balance the traffic rather than increase levels of congestion.
A perfect example of this is hospitals. Staff members are at the hospital on long shifts, visitors spend hours there, and ridesharing vehicles come by regularly. Other places, like universities, transit park-and-ride facilities, and mixed-use locations, give a similar opportunity.
Proper application of demand stacking requires getting the right mix of chargers. Users who often charge their cars should not go using high-power chargers needlessly. In contrast, a user who charges infrequently should not rely solely on low-power chargers. Importantly, a mixed situation helps meet various needs thus avoiding congestion.
Dynamic pricing encourages flexible customers to show up during low-use periods, and idle fees reduce the chance that vehicles will monopolize charging facilities. The best examples of mixed-use developments include various types of customers that support rather than compete with one another.
| User group |
Typical demand period |
Typical dwell time |
Recommended charging approach |
Suitable locations |
| Office employees |
Weekday daytime |
4–8 hours |
Level 2 charging |
Offices and business parks |
| Apartment residents |
Evening and overnight |
6–12 hours |
Managed Level 2 charging |
Multifamily housing and curbside sites |
| Retail and fitness customers |
Late afternoon and evening |
45–120 minutes |
Level 2 or mid-power DC charging |
Mixed-use centers and gyms |
| Hospital staff and visitors |
Throughout the day |
2–12 hours |
Mixed Level 2 and DC fast charging |
Hospitals and medical campuses |
| Rideshare and delivery drivers |
Evening, late night and peak travel periods |
20–45 minutes |
DC fast charging |
Urban mobility and fleet hubs |
| Transit commuters |
Weekday daytime |
6–10 hours |
Level 2 charging |
Park-and-ride facilities |
| Hotel guests |
Evening and overnight |
8–12 hours |
Level 2 destination charging |
Hotels and resorts |
Note:Based on the above situation, mixed-use developments can improve load curve performance and utilize more assets by merging different user groups that employ electricity consumption at different times.
Queue-Aware Site Selection: Measure Competition by Wait Time, Not Charger Count
The evaluation of competitors usually starts with a table indicating the locations of rival stations, but the count of chargers may not be accurate. An establishment may have 20 charging spots, but only a limited number may be operational owing to shutdowns, lack of power, or obstructions in the lot.
The accepted metric is efficient service capacity, which consists of learning of the working port numbers, average supply of power, session length, accessibility, and traffic. In addition, queue size and abandonment behavior must be studied.
When a zone has multiple stations available, opening a new station may still be justified if the infrastructure at the current stations is poor or overloaded. On the contrary, if there are very few charging points in a zone, not much traffic may be seen because many motorists charge their automobiles at home.
The queue-aware planning process needs to be effective and must consider in its calculations the vehicle inflow, the average time of service, or the number of charging stations available. Even basic queue models can indicate whether four charging stations are sufficient or it is better to have eight of them, otherwise, the waiting time can exceed acceptable values.
Competitors must be grouped into categories according to their sector. For instance, power fleet hub is not competing with a low-cost Level 2 network. The purpose is to recognize demand for a service that is not currently available, instead of just finding an empty area on the map.
Reliability and Grid Readiness: Can the Site Deliver What Demand Models Promise?
It is crucial to consider the quality of service that the charging station will provide at the very outset of the site selection process, technical solution selection, and financial planning.
KPI entails the availability of chargers, first-pass effectiveness, completion of payment, the actual power given against promised power, and time taken to repair. If the charger is working but cannot start a session, it should not be regarded as being available.
The physical design has also the effect on reliability. Cable length, parking position, connector compatibility, lighting, drainage, weather-proofing and cell connection can influence session outcomes. Safety and convenience should be regarded as operational parameters rather than separate design features.
Grid readiness plays an equally crucial role in the selection process. A site can possess high demand but still require an expensive transformer upgrade or modification, long interconnection timeframe, or extensive civil works. It is the responsibility of planners to properly analyze the existing capacities, utility rates, demand fees, distance for trenching, and any possible expansions.
Battery storage and smart load management can reduce peak demand and defer some upgrades, but they cannot replace a realistic electrical assessment. The business case should model both initial deployment and future port expansion.
A practical approach is to score demand quality and buildability separately. A high-demand site with poor grid access may rank below a moderate-demand site that can be delivered quickly and scaled efficiently.
Frequently Asked Questions
1. What is the best location for an EV charging station?
The best location is one with consistent EV demand, suitable parking dwell time, reliable grid access and limited competition from nearby working chargers.
2. Does high traffic guarantee high EV charger utilization?
No. High traffic does not always lead to charging demand because many drivers may not stop, may already charge at home or may not stay long enough to complete a useful session.
3. How do you choose a profitable EV charging station site?
A profitable site should combine strong charging demand, good visibility, easy vehicle access, manageable electricity costs and enough users throughout the day.
4. Are apartment areas good locations for EV charging stations?
Yes. Apartment districts can create stable public charging demand because many residents do not have garages, private driveways or assigned parking with charging access.
5. Should a site use Level 2 chargers or DC fast chargers?
It depends on dwell time. Level 2 charging works well where vehicles park for several hours, while DC fast charging is better for rideshare drivers, fleets and short-stop users.
6. How many charging ports should an EV charging station have?
The number of ports should be based on vehicle arrival rates, average charging time, peak demand and acceptable waiting time rather than a fixed industry average.
7. Why is grid capacity important in EV charging station site selection?
Grid capacity determines how much charging power a site can support and whether costly transformer upgrades, battery storage or long utility interconnection delays will be required.
8. How can AI improve EV charging station site selection?
AI can analyze EV registrations, mobility patterns, parking behavior, charging sessions and grid constraints to forecast demand and rank candidate locations more accurately.
As a professional EV charging solution provider and manufacturer, XYDF delivers localized, customized charging solutions backed by in-house R&D, a 40,000-square-meter production base, and end-to-end capabilities spanning structural design, hardware selection, software development, platform integration, testing, and certification.
Looking for a reliable partner for your next EV charging project? Contact XYDF to discuss a tailored solution for your market and application.
References
International Energy Agency. “Global EV Outlook 2026: Electric Vehicle Charging.” IEA, 2026.
Joint Office of Energy and Transportation. “Public EV Charging Station Site Selection Checklist.” DriveElectric.gov, October 2023.
 Xinya Dongfang Electricity Technology Co., Ltd.