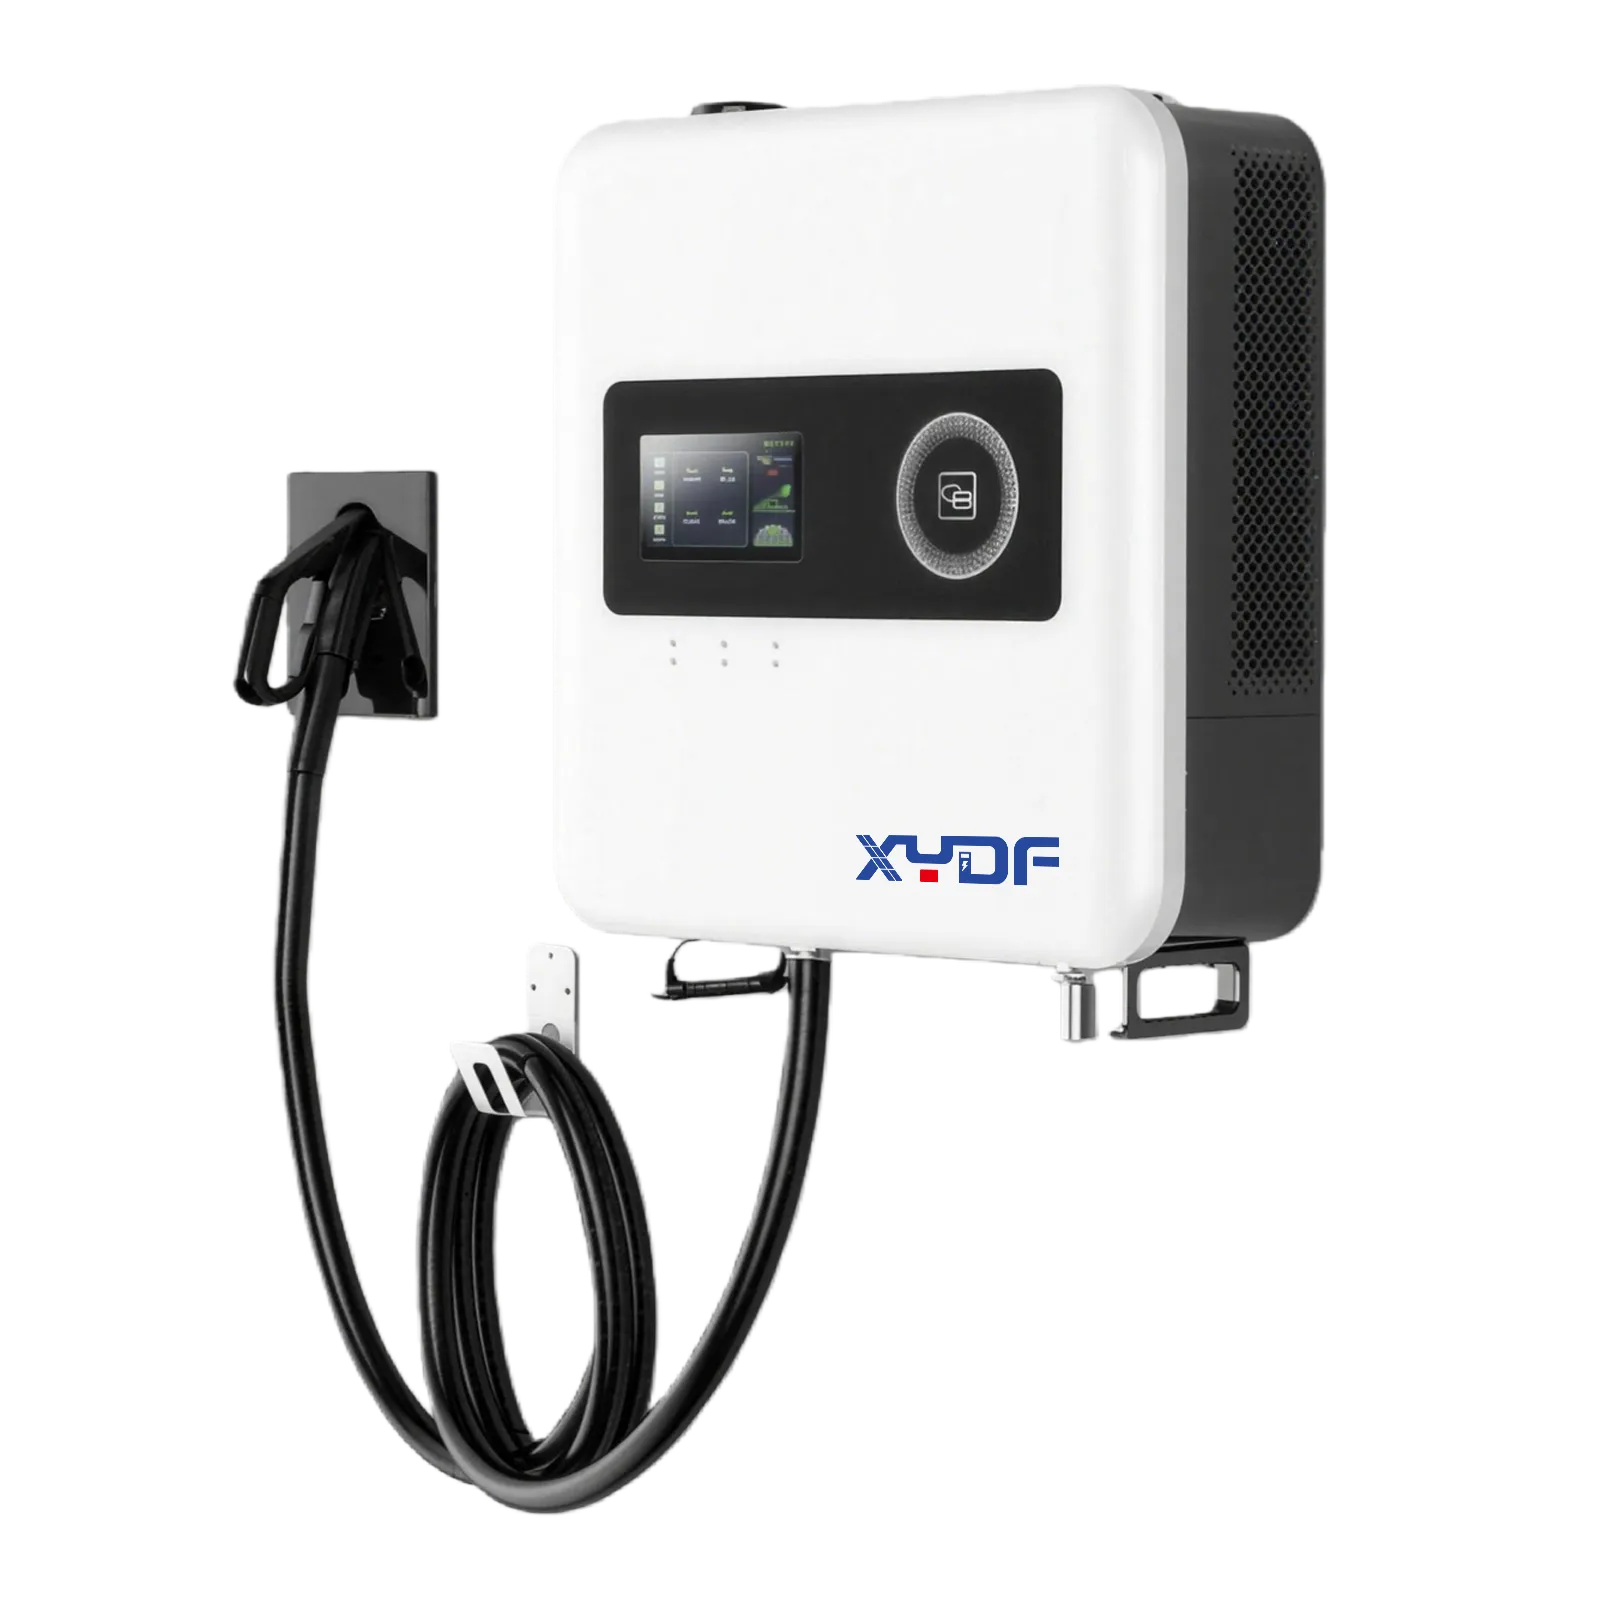
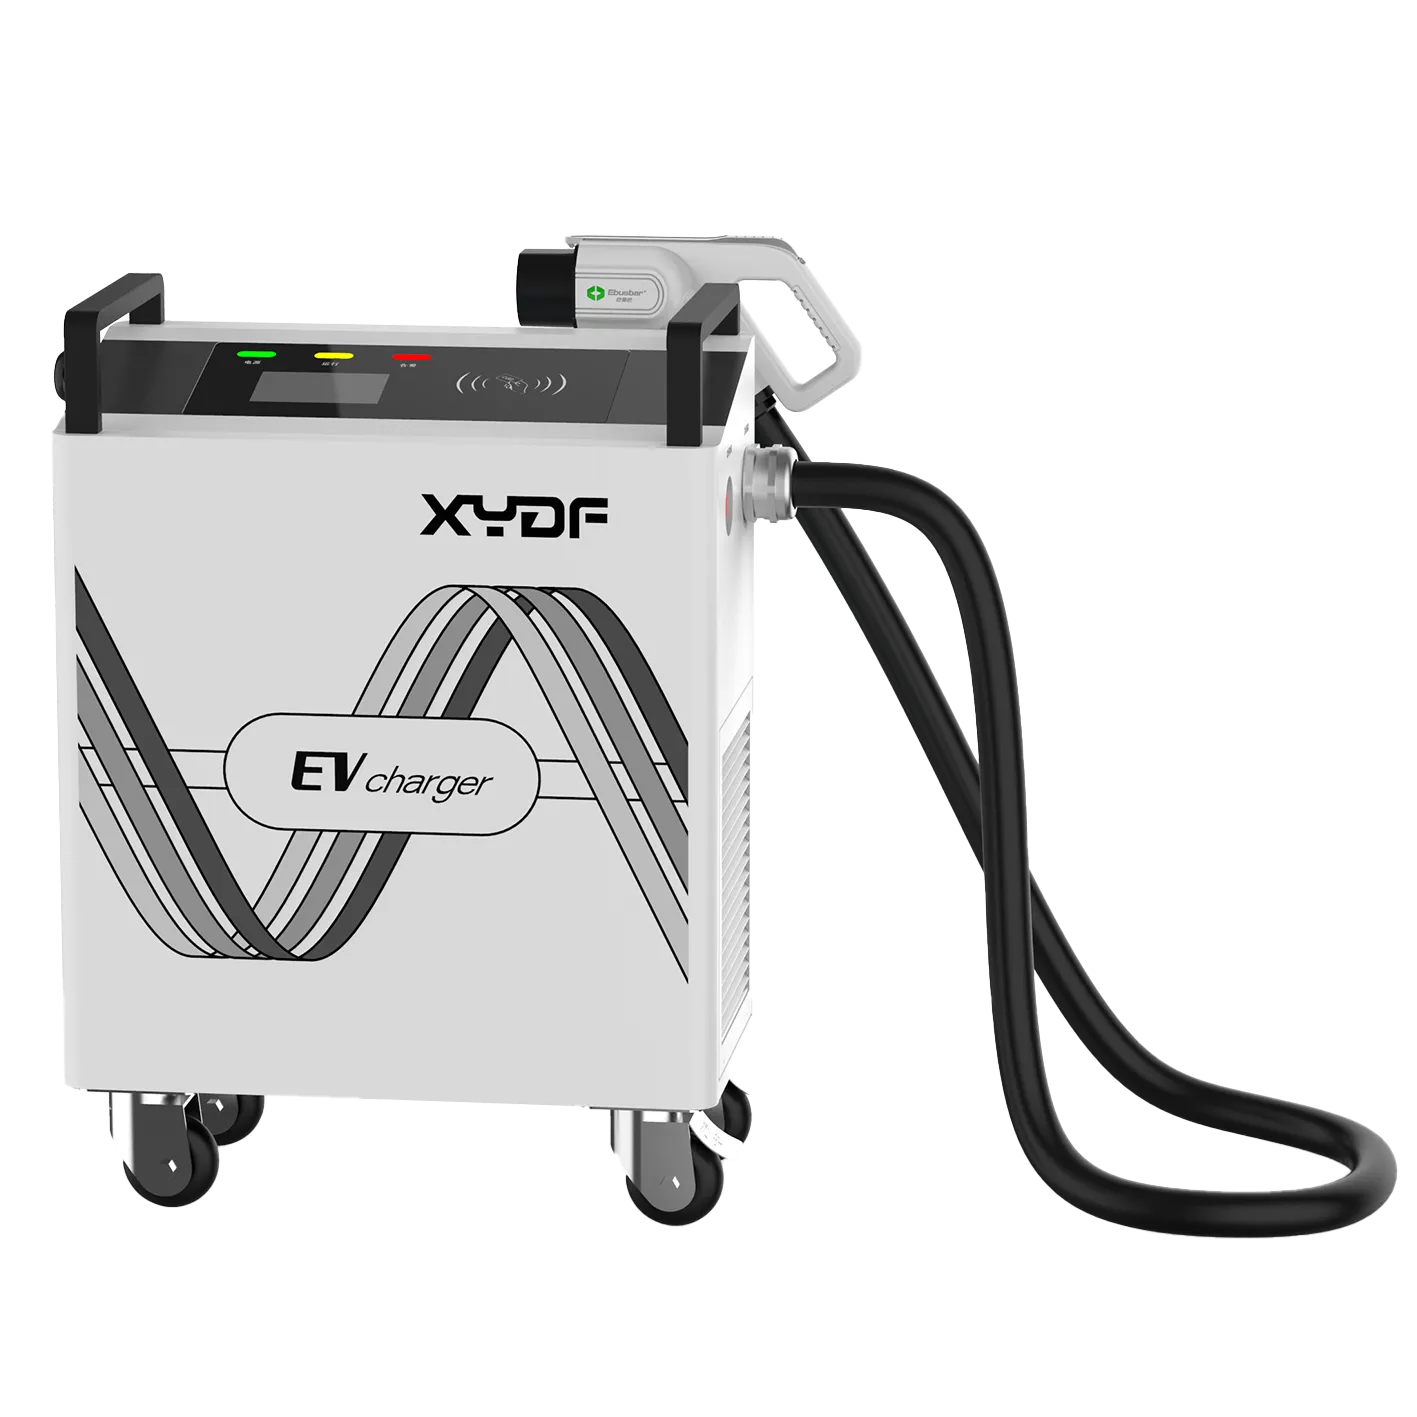
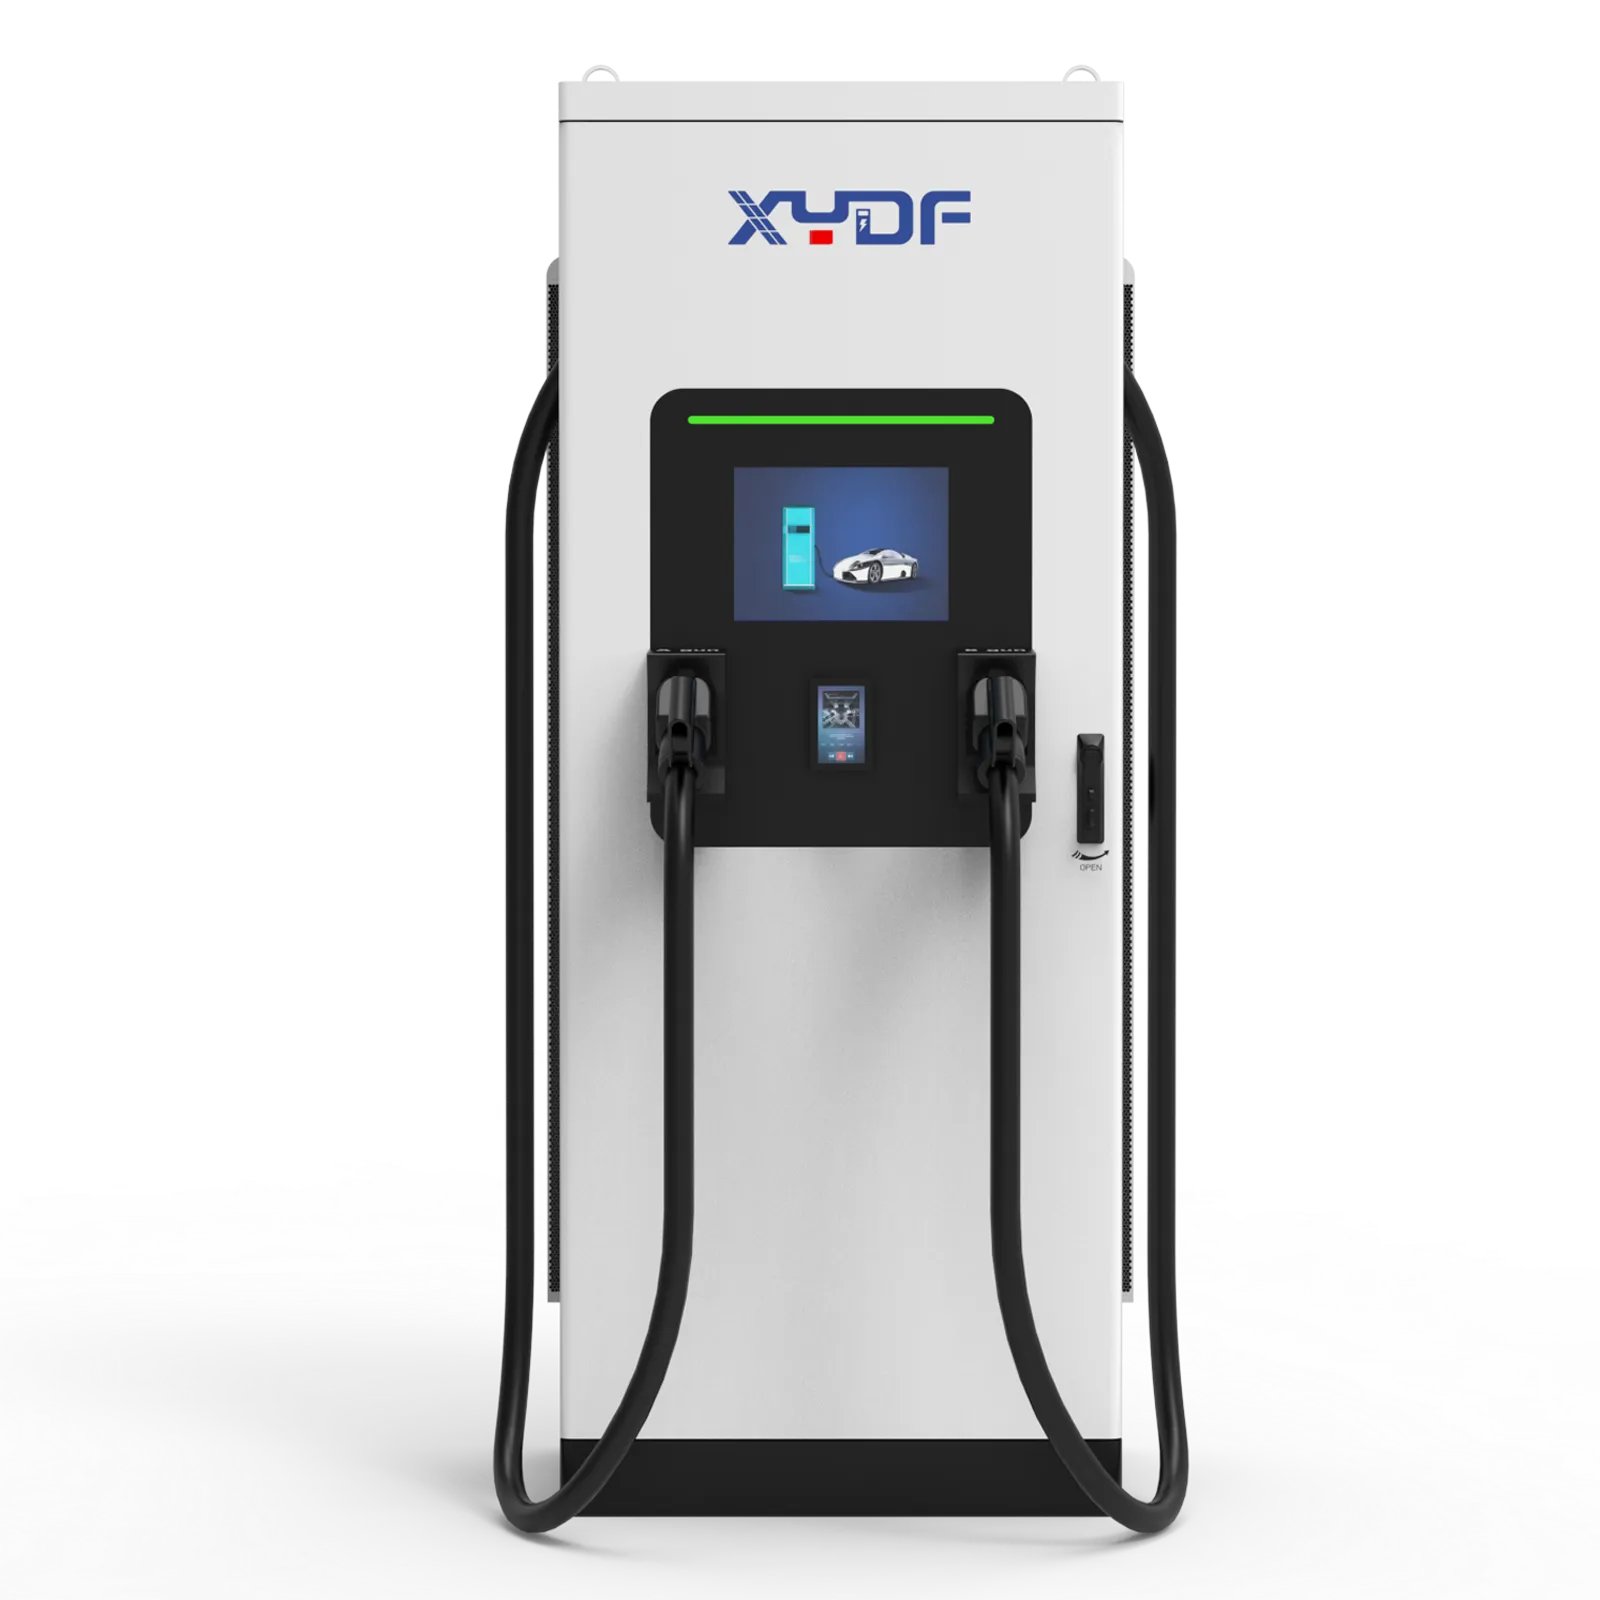
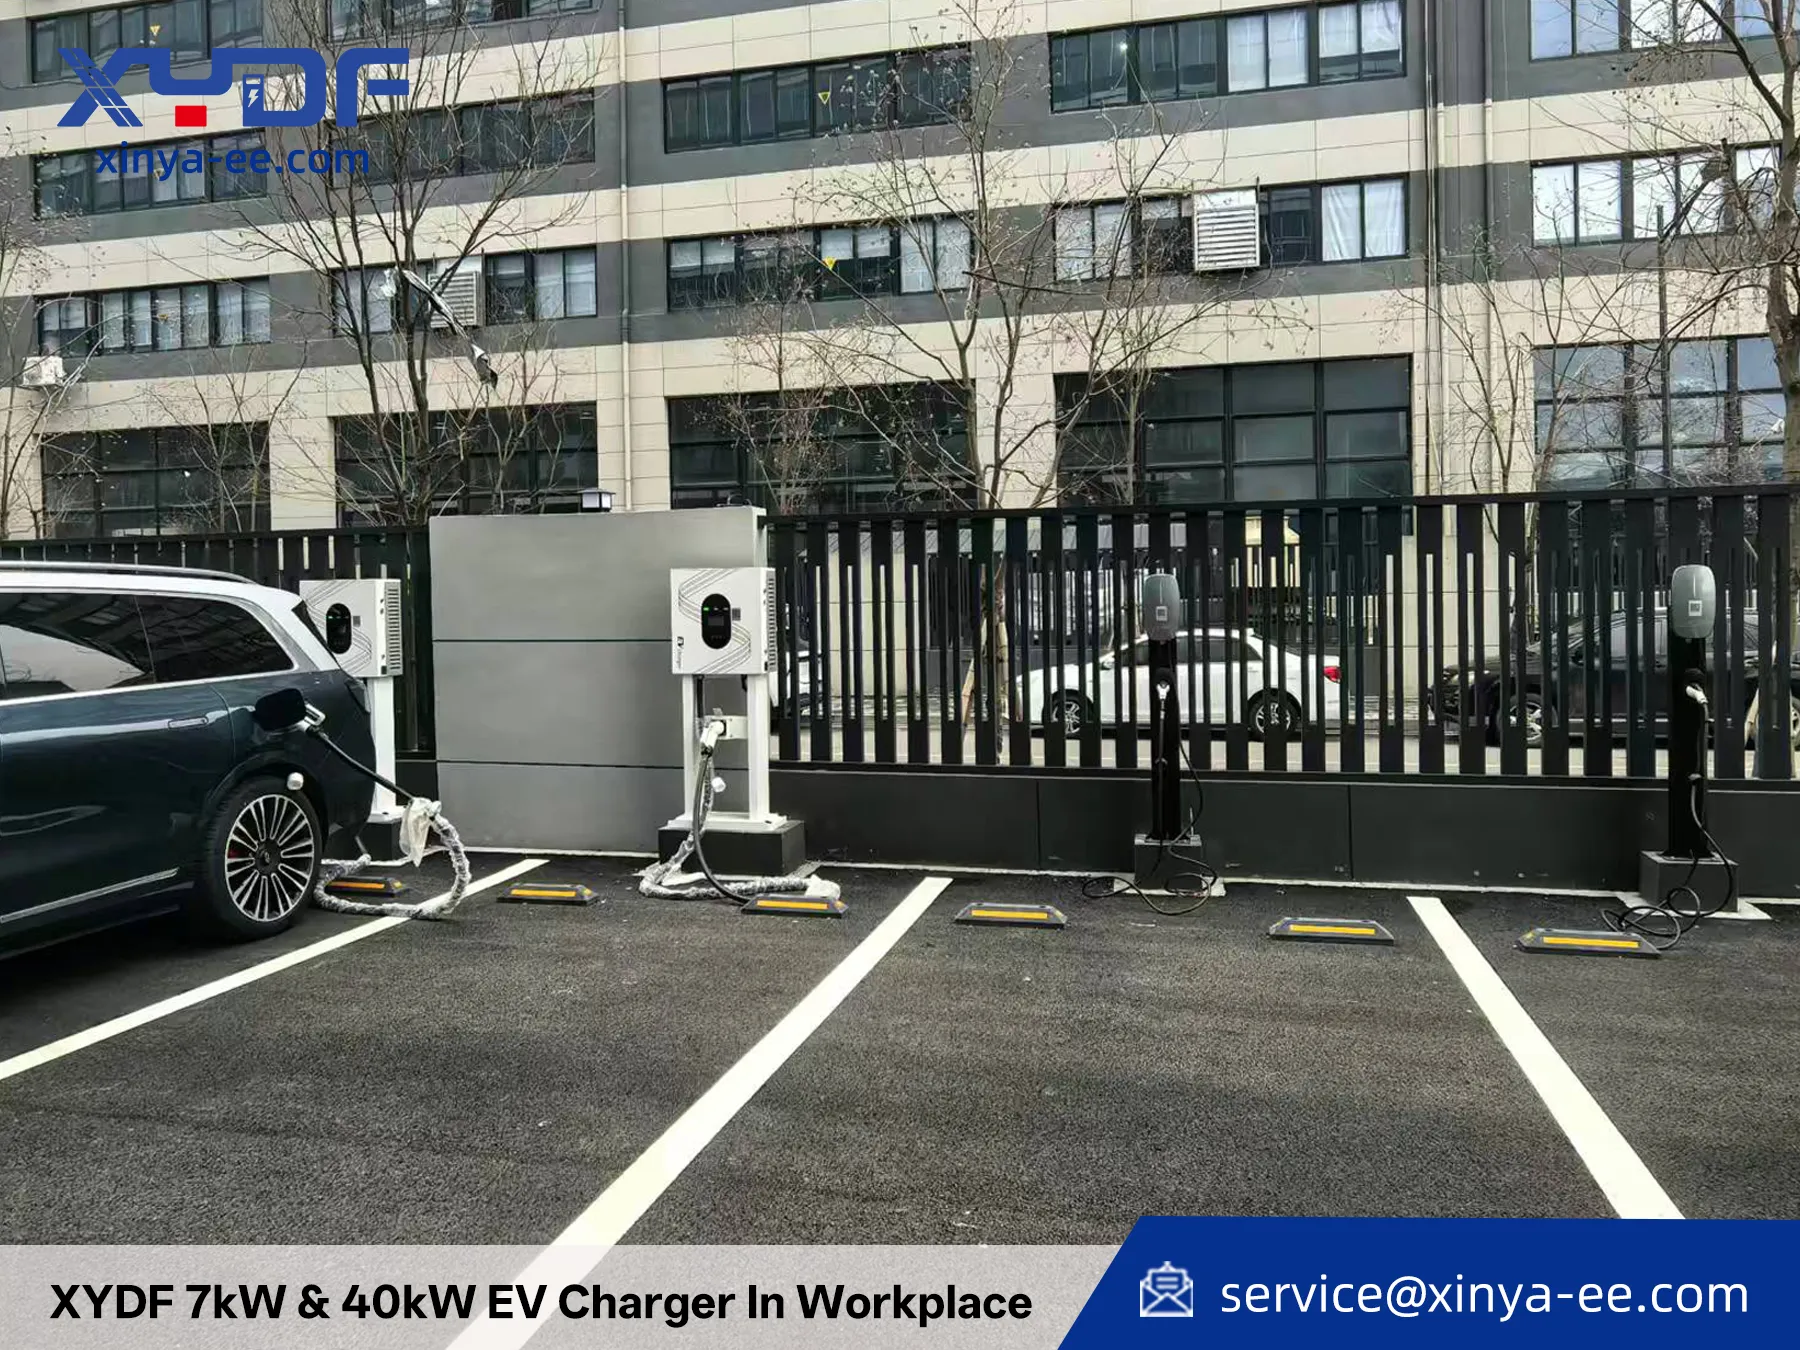
A commercial charging payback forecast based only on upfront hardware cost and projected charging revenue can fail when utility demand charges, trenching, and transformer upgrades are added. The hardware may function as intended while the financial model fails. Total cost of ownership and dynamic load management therefore belong in the investment analysis.
commercial EV charging station payback often uses a broad screening range; the average payback period for a Commercial EV charging Station typically ranges from 3 to 7 years. This timeline is dictated not just by upfront hardware costs, but by utilization rates, utility demand charges, and site preparation expenses. According to a recent BloombergNEF analysis, achieving profitability requires a utilization rate of at least 10-15% for fast chargers, coupled with smart energy management. This guide breaks down the true capital expenditures (CapEx) and operational expenditures (OpEx) to help operators and contractors calculate a realistic and profitable ROI.
For an investment decision, treat any broad payback range above as screening context, not a forecast. A site-specific result must be rebuilt from the tariff, delivered-energy data, commercial contracts and a time-phased cash-flow model.
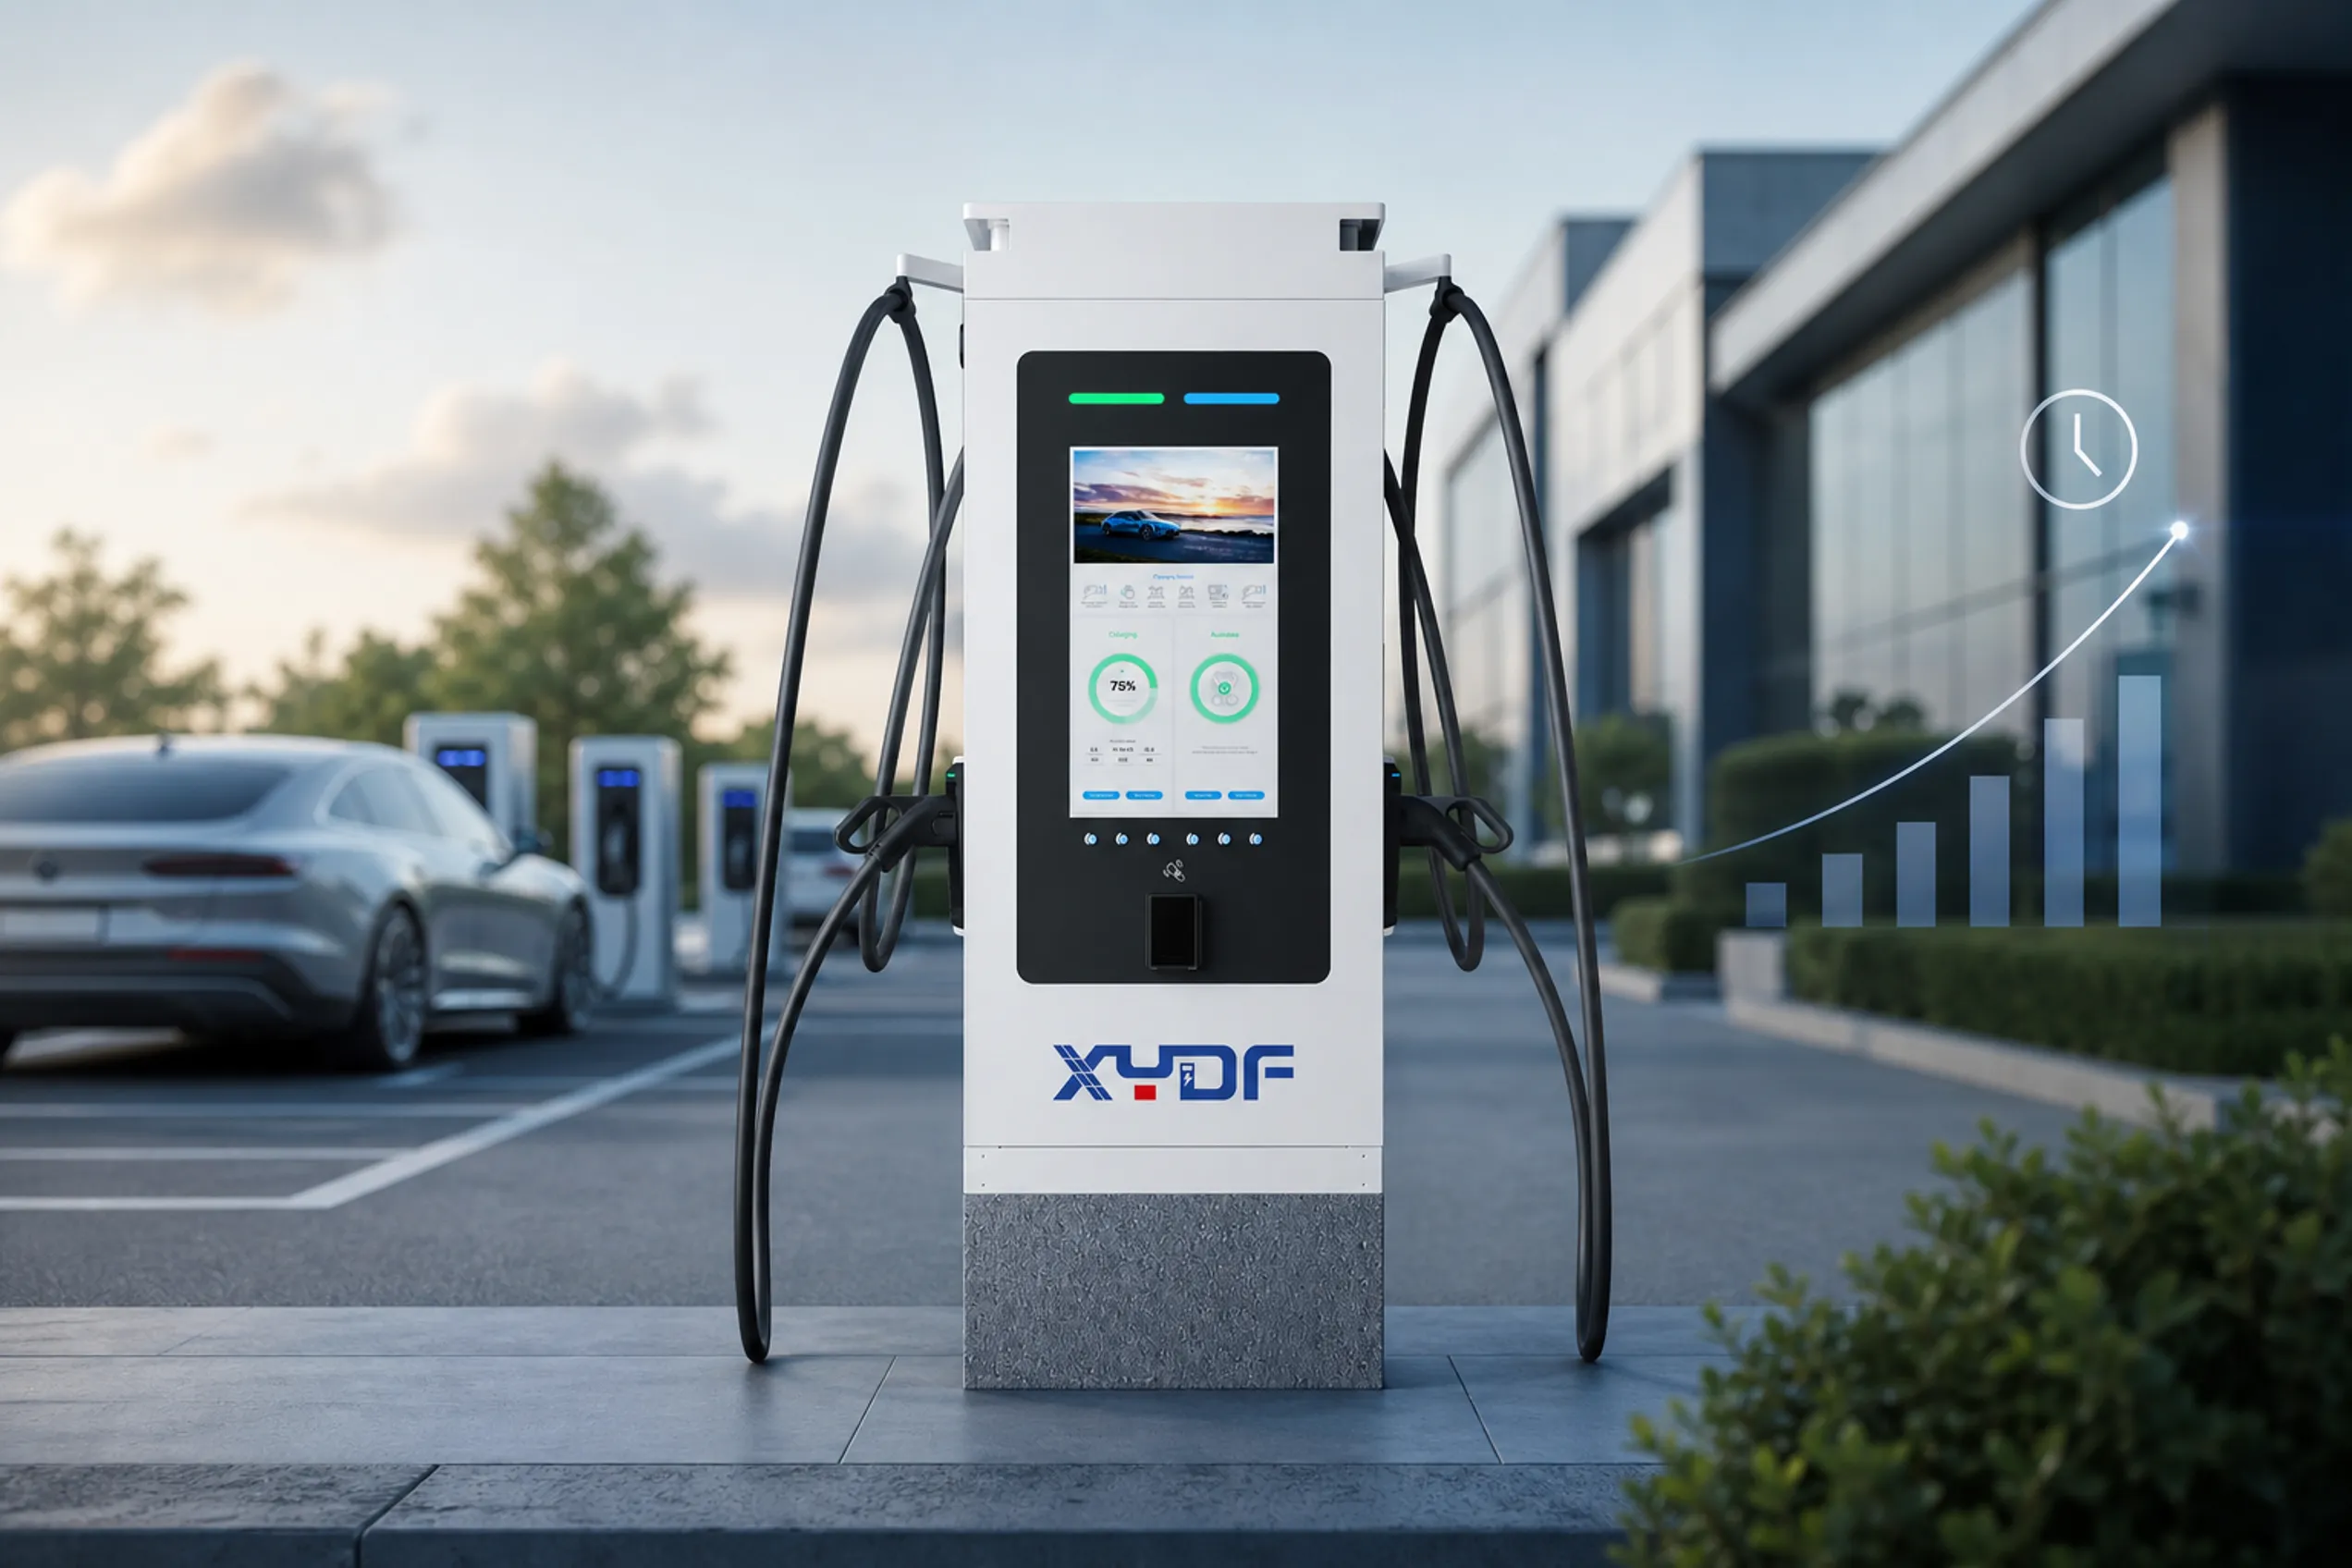
What belongs in commercial charging CapEx?
To accurately calculate when an EV charging Station will pay for itself, operators must look beyond the sticker price of the charger. The initial Capital Expenditure (CapEx) is divided into three main categories, and the hardware is rarely the most expensive part.
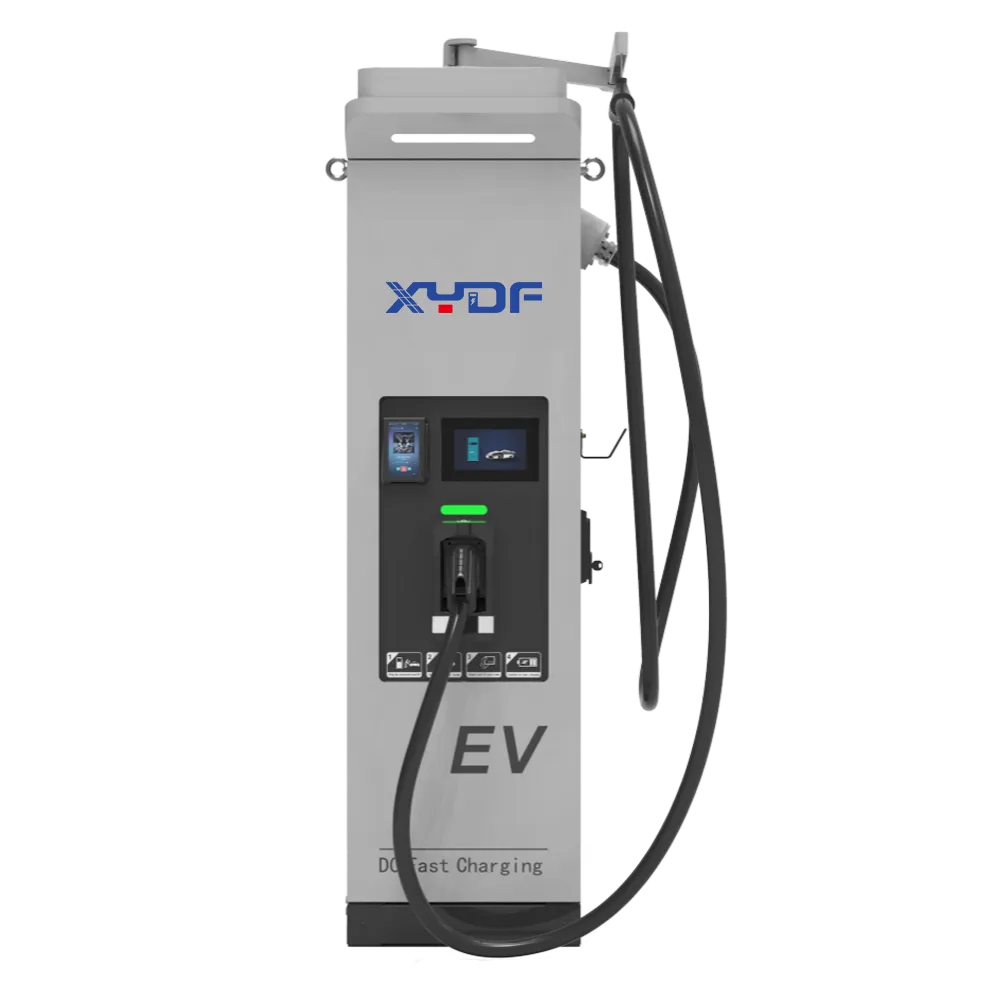
- The Hardware Costs: While many property investors base their estimates on the relatively low cost of home electric car charging station setups, commercial infrastructure operates on an entirely different financial scale. A standard commercial Level 2 AC charger typically costs between $1,000 and $2,500 per port. In contrast, a level 3 charging station (DC Fast Charger, 50kW to 350kW) can range from $15,000 to over $75,000 depending on the power output and liquid-cooling technology.
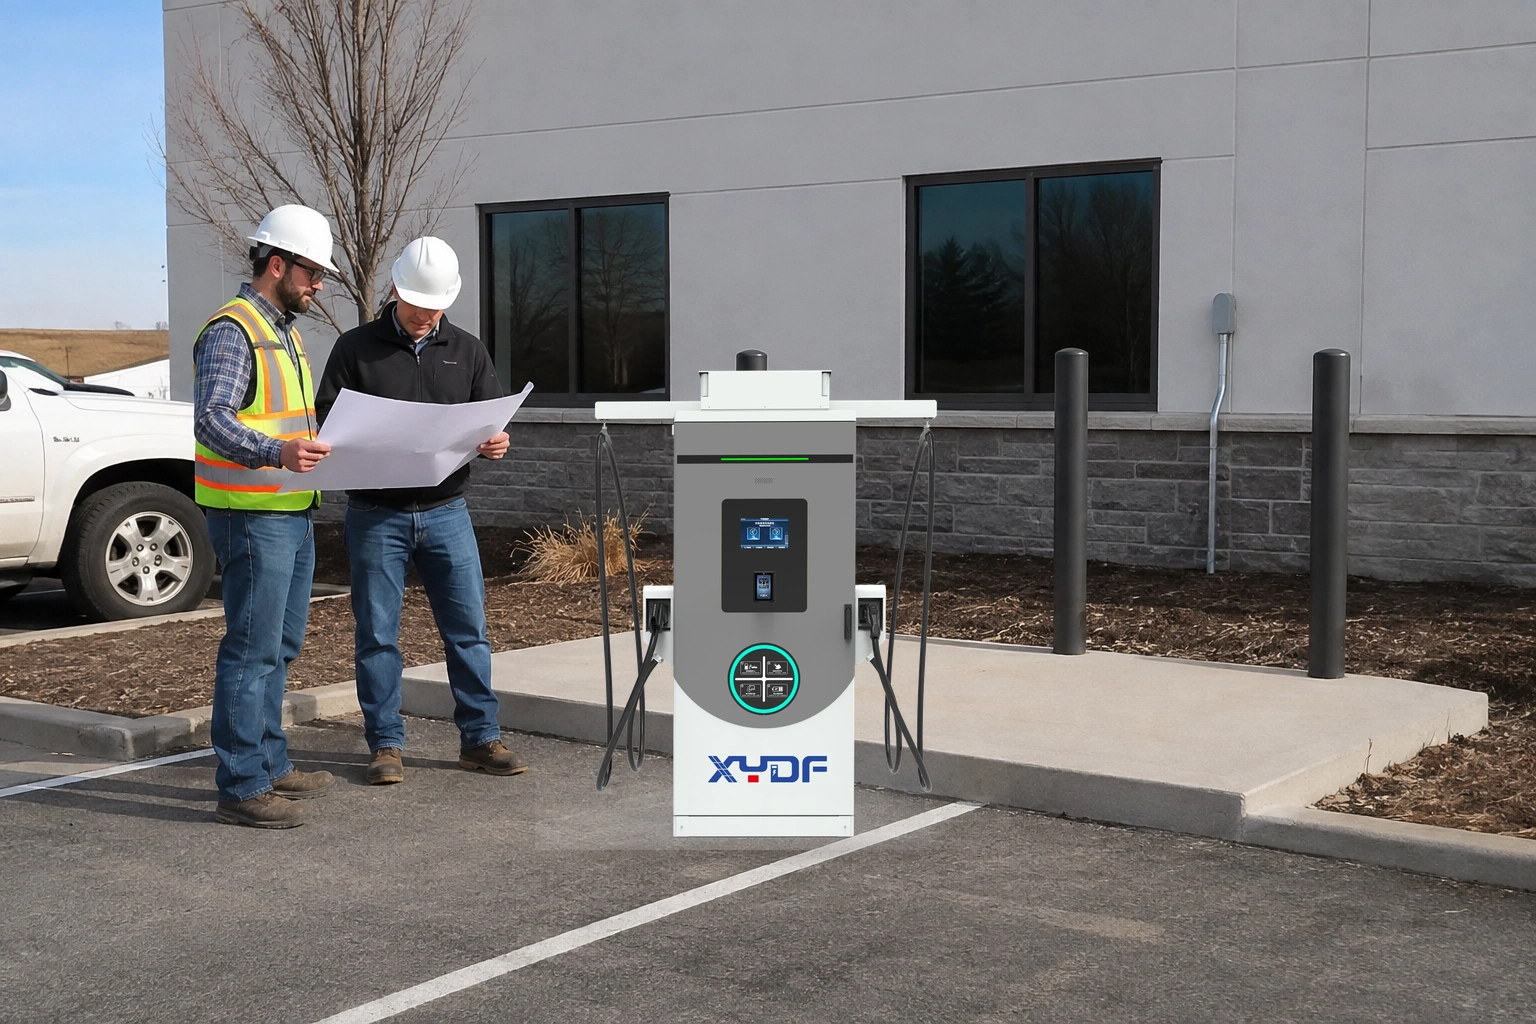
- Infrastructure and Grid Upgrades (The Hidden Giant): Often accounting for 60% to 70% of the total CapEx, this includes trenching, laying conduit, pouring concrete pads, and upgrading the site’s electrical panel or transformer. According to the National Renewable Energy Laboratory (NREL), upgrading a transformer to support multiple 150kW chargers can add $20,000 to $50,000 to the project.
- Permitting and Commissioning: Local municipal permits, ADA compliance (Americans with Disabilities Act) site modifications, and software commissioning fees add another 10% to the initial budget.
Which operating costs can erode margin?
Operational expenditure (OpEx) is where poorly planned projects lose margin. Understanding these recurring costs is critical for a realistic ROI projection.
- Utility Demand Charges: Commercial electricity rates often include demand charges—fees based on the highest 15-minute peak power usage during a billing cycle. If four 120kW chargers operate simultaneously at full capacity, the sudden 480kW spike can trigger thousands of dollars in demand fees, destroying profitability.
- Network and Software Fees: Operating a Commercial EV charging Station requires a backend management system (CSMS) to process payments, monitor charger health, and manage users. This typically costs $200 to $500 per port, per year.
- Maintenance and Warranties: Routine maintenance, replacing damaged cables, and extended SLA (Service Level Agreement) warranties generally cost 5% to 10% of the hardware price annually.
How should the model reproduce tariffs and time of use?
A blended cents-per-kWh assumption can hide the largest error in a fast-charging forecast. Allocate interval energy to the tariff’s time periods, calculate the applicable demand determinant using the utility’s stated interval and rules, and include customer, subscription, minimum-bill, tax and surcharge items where applicable. Tariffs differ by utility and jurisdiction; SMUD’s published business rate page, which lists separate commercial time-of-day schedules by demand range, is one example of why the actual rate sheet—not a universal demand-charge assumption—belongs in the diligence file. See the practical guide to commercial charging peak-demand cost control.
Run the calculation for 12 individual bills rather than multiplying one representative month by 12. Seasonal rates, one exceptional coincident peak and the ramp in charging volume can change the relationship between energy sold and electricity cost. If the project uses managed charging or storage, show controller limits, efficiency losses, reserve policy and degradation or replacement cash flows; do not book savings that the operating strategy cannot physically deliver.
How do Level 2 and DC fast-charging ROI profiles differ?
Different business models dictate different hardware choices. Below is a procurement comparison illustrating how power levels impact the payback period.
| نوع الشاحن |
Average CapEx (Per Port, Installed) |
Primary Revenue Driver |
Estimated Utilization Needed for Profit |
Average ROI Timeframe |
Ideal Buyer / Location |
| Level 2 AC (22kW) |
$2,500 — $6,000 |
Dwell time (Retail, Hotels, Workplaces) |
15% — 20% (approx. 3-4 hours/day) |
2 to 4 Years |
Property Managers, Hospitality, Office Parks |
| Level 3 charging station (DC Fast, 50kW — 120kW) |
$30,000 — $60,000 |
Turnover volume (Supermarkets, Fleets) |
10% — 15% (approx. 2-3 hours/day) |
4 to 6 Years |
Retail Plazas, Delivery Fleets, Dealerships |
| Ultra-Fast (150kW+) |
$70,000 — $120,000+ |
Premium pricing (Highways, Fuel Stations) |
15%+ (approx. 3.5+ hours/day) |
5 to 7 Years |
CPOs, Highway Rest Stops, Heavy-duty Fleets |
The most useful commercial EV charging station ROI model is transparent enough for an investor, utility account manager and procurement team to challenge the same inputs. Start with cash actually committed at month zero and later construction milestones: charging equipment, design, civil and electrical work, utility interconnection, permits, commissioning and initial spares. The U.S. Department of Energy’s Alternative Fuels Data Center (AFDC) likewise frames charging-project costs as equipment, installation, operation and maintenance, including electricity, demand charges and annual network fees.
Then model recurring cash flow separately. Revenue may include charging sales and separately evidenced host payments; operating outflows may include volumetric electricity, demand and fixed utility charges, software, payment processing, service agreements, repairs, site lease or revenue share, insurance and administration. Do not insert grants, tax credits, depreciation benefits or carbon-credit income unless eligibility, timing and monetization have been confirmed for the project’s jurisdiction and taxpayer.
| مدخل |
Site case to enter |
Assumed value used below |
Evidence to obtain |
| Initial cash investment |
[currency and amount] |
USD 180,000 |
Signed equipment, works, design, permit, interconnection and commissioning quotations |
| Stabilized annual energy sold |
[kWh/year] |
210,000 kWh/year |
Metered comparable-site data or a traffic-to-energy model |
| Realized charging price |
[currency/kWh, net of discounts] |
USD 0.50/kWh |
Pricing policy, discount mix, taxes and refund history |
| Volumetric electricity cost |
[time-of-use rates and kWh] |
USD 0.18/kWh assumed in this example |
Current utility tariff and interval-load model |
| Demand and fixed utility charges |
[amount/year] |
USD 18,000/year |
Applicable rate schedule, billing determinant and 12 monthly simulations |
| Payment processing |
[% of charging sales plus fixed fees] |
3% of charging sales |
Acquirer and platform agreement |
| Software and networking |
[amount/year] |
USD 6,000/year |
Backend, connectivity and roaming contracts |
| Service and maintenance |
[amount/year] |
USD 8,000/year |
SLA, preventive-maintenance plan, parts and field-labor assumptions |
| Lease, insurance and administration |
[amount/year] |
USD 12,000/year |
Executed lease/revenue-share terms, insurance quote and operating budget |
| Ramp-up and downtime |
[monthly factors] |
Excluded from the one-year illustration; must be added to the project model |
Opening date, monthly adoption curve and availability/repair evidence |
How do the assumptions affect payback?
The figures below are assumed in U.S. dollars and exclude financing, tax, depreciation, incentives and terminal value. A project-specific quotation and forecast require verified site inputs.
Using the editable inputs above, annual charging sales are 210,000 kWh × USD 0.50 = USD 105,000. Volumetric electricity is 210,000 kWh × USD 0.18 = USD 37,800. Subtract USD 18,000 of demand/fixed utility charges, USD 3,150 of payment processing, USD 6,000 of software/networking, USD 8,000 of service/maintenance and USD 12,000 of lease/insurance/administration. The resulting stabilized-year operating cash flow is therefore USD 20,050.
Simple payback on that stabilized year is USD 180,000 ÷ USD 20,050, or approximately 9.0 years. That is not the calendar payback: a ramp-up year, staged capital payments, commissioning delay, downtime, working capital or equipment replacement changes the date on which cumulative cash flow turns positive. A proper model locates that crossover in the monthly cash-flow row.
What happens when downside and upside assumptions move together?
| Scenario input or result |
Downside illustration |
Base illustration |
Upside illustration |
| Annual energy sold |
140,000 kWh |
210,000 kWh |
300,000 kWh |
| Realized charging price |
USD 0.48/kWh |
USD 0.50/kWh |
USD 0.52/kWh |
| Volumetric electricity cost |
USD 0.20/kWh |
USD 0.18/kWh |
USD 0.16/kWh |
| Demand and fixed utility charges |
USD 22,000/year |
USD 18,000/year |
USD 15,000/year |
| Other fixed operating costs |
USD 28,000/year |
USD 26,000/year |
USD 27,000/year |
| Payment processing |
3% of sales |
3% of sales |
3% of sales |
| Calculated stabilized-year operating cash flow |
–USD 12,816 |
USD 20,050 |
USD 61,320 |
| Initial investment divided by that cash flow |
No payback while cash flow remains negative |
Approximately 9.0 years |
Approximately 2.9 years |
This sensitivity table is deliberately not a market forecast. Replace every cell with site evidence, add the monthly ramp and time the cash outflows; the wide spread demonstrates why a single industry-average payback period is not decision-grade. Where capital preservation is more important than ownership, compare the cash-flow timing of Charging-as-a-Service and upfront CapEx on the same scope.
How do simple payback, NPV, and IRR differ?
Simple payback asks when cumulative undiscounted project cash inflows recover the initial cash outlay. It is easy to audit, but it ignores the time value of money, usually ignores cash flows after the crossover date and can conceal a large replacement soon afterward. Net present value (NPV) discounts every dated project cash flow—including later replacements and residual value—at the investor’s required rate; a positive NPV means the modeled project clears that rate under those assumptions. Internal rate of return (IRR) is the discount rate that makes NPV zero, but NPV is generally easier to interpret when projects differ in scale or cash flow changes sign more than once.
The U.S. Department of Energy’s building life-cycle cost resources distinguish life-cycle economics from first-cost decisions and provide federal analysis tools. Commercial investors should use their own discount rate, tax treatment, financing terms and analysis horizon, with local professional advice. Keep an assumption version, owner, source date and approval status for each input so the investment committee can see what changed between screening, tender and operation.
Which cost drivers delay ROI, and which levers accelerate revenue?
To shorten the payback period of a Commercial EV charging Station, operators must manipulate specific cost and revenue levers. Here is a breakdown of what drives costs up and what accelerates revenue.
| بعد |
Cost Drivers (Delays ROI) |
Revenue Accelerators (Shortens ROI) |
| إدارة الطاقة |
Unmanaged charging triggering peak utility demand charges. |
Implementing Dynamic Load Balancing (DLB) to cap peak grid draw. |
| Pricing Strategy |
Flat per-kWh pricing that ignores time-of-use (TOU) utility rates. |
Dynamic pricing (charging users more during peak grid hours). |
| Funding & Subsidies |
Bearing 100% of the CapEx out of pocket. |
Leveraging NEVI funds, local utility rebates, or carbon credits (e.g., LCFS). |
| Site Selection |
Installing in low-traffic areas with poor cellular connectivity. |
High-visibility locations with existing amenities (coffee shops, restrooms). |
How do delivered energy and utilization connect sessions to revenue?
Session count alone does not produce charging revenue. Convert sessions into delivered kWh: sessions multiplied by average billable kWh per session, after free sessions, failed starts, refunds and energy not billed under the contract. A site with many short top-ups can record more sessions but sell less energy than a fleet depot with fewer, deeper charging events. Keep ancillary parking or retail income on a separate line so the charging asset’s economics remain visible.
Define utilization before using it. An energy-based measure is delivered kWh divided by the site’s deliverable kW multiplied by hours in the period. Do not automatically add every connector’s nameplate rating: shared power cabinets, power allocation, vehicle charging curves and non-simultaneous ports can make that denominator impossible in practice. Build the base case month by month, with a documented opening ramp and at least a downside case; the companion guide on calculating charging-station utilization provides a deeper operating view.
Charger mix matters for the same reason. AC charging, lower-power DC and high-power DC serve different dwell times and throughput needs; the model should forecast energy and occupancy for each charger group rather than apply one average to the whole site. NREL’s national infrastructure analysis reports charging requirements by charging level and location, which is a useful reminder that a network plan is a mix problem—not evidence that any single mix will be profitable at a specific address.
Model downtime once, not twice. Either reduce available hours and derive lower delivered energy, or apply an availability factor to the energy forecast. Then add repair cash costs separately. Connector-level outages, whole-site outages and planned maintenance have different revenue effects, while a demand charge set earlier in a billing period may remain even if the station later goes offline.
How do standards and compliance affect profitability?
An EV charging Station that fails to comply with international standards is a stranded asset. Non-compliance leads to hardware incompatibility, inability to process payments, and exclusion from government grant programs, permanently ruining the ROI.
- OCPP 1.6J / 2.0.1 (Open Charge Point Protocol): This is the universal language between the charger and the backend software. Chargers locked into proprietary software (non-OCPP) force you to pay whatever software fees the manufacturer demands. OCPP compliance ensures you can switch software providers to lower your OpEx.
- ISO 15118 (Plug & Charge): This standard enables seamless communication between the EV and the charger, allowing drivers to simply plug in and automatically pay without swiping a card. It increases user convenience and drives higher utilization rates.
- Safety Certifications (UL 2594 / UL 2202 / CE / CCC): Electrical inspectors will not permit the energization of a Commercial EV charging Station without these certifications. Uncertified equipment will fail inspection, resulting in total capital loss.
How can procurement protect the ROI model?
For EPC contractors and fleet managers, avoiding financial pitfalls requires strategic procurement. Here are the critical steps to ensure your charging infrastructure pays for itself on schedule:
- Mandate Dynamic Load Balancing (DLB): Never install a multi-charger site without DLB. This software feature distributes available power among multiple vehicles, ensuring the total draw never exceeds the site’s electrical capacity, thereby avoiding expensive transformer upgrades and utility demand charges.
- Future-Proof the Underground Infrastructure: Trenching is expensive. Even if you are only installing two chargers today, lay enough oversized conduit to support ten chargers in the future. The incremental cost of extra PVC pipe is negligible compared to ripping up the asphalt a second time.
- Demand Open Protocols: Only purchase hardware that is fully certified for OCPP 1.6J or 2.0.1. This guarantees your hardware remains agnostic and adaptable to future software innovations.
- Partner with Certified Manufacturers: Sourcing directly from reputable manufacturers reduces middleman markups and ensures compliance.
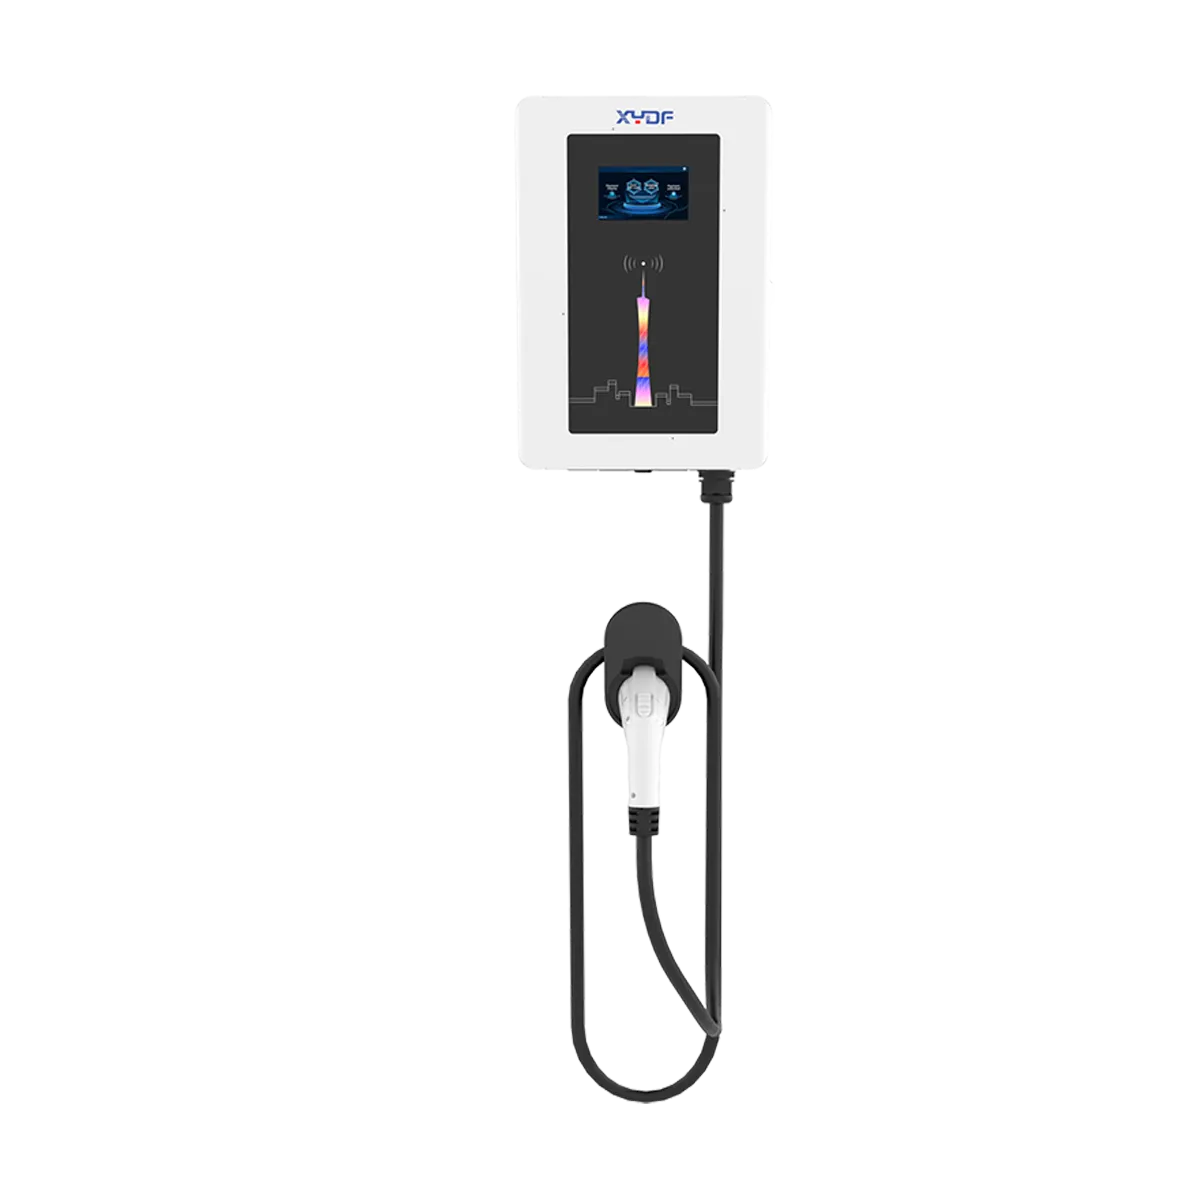
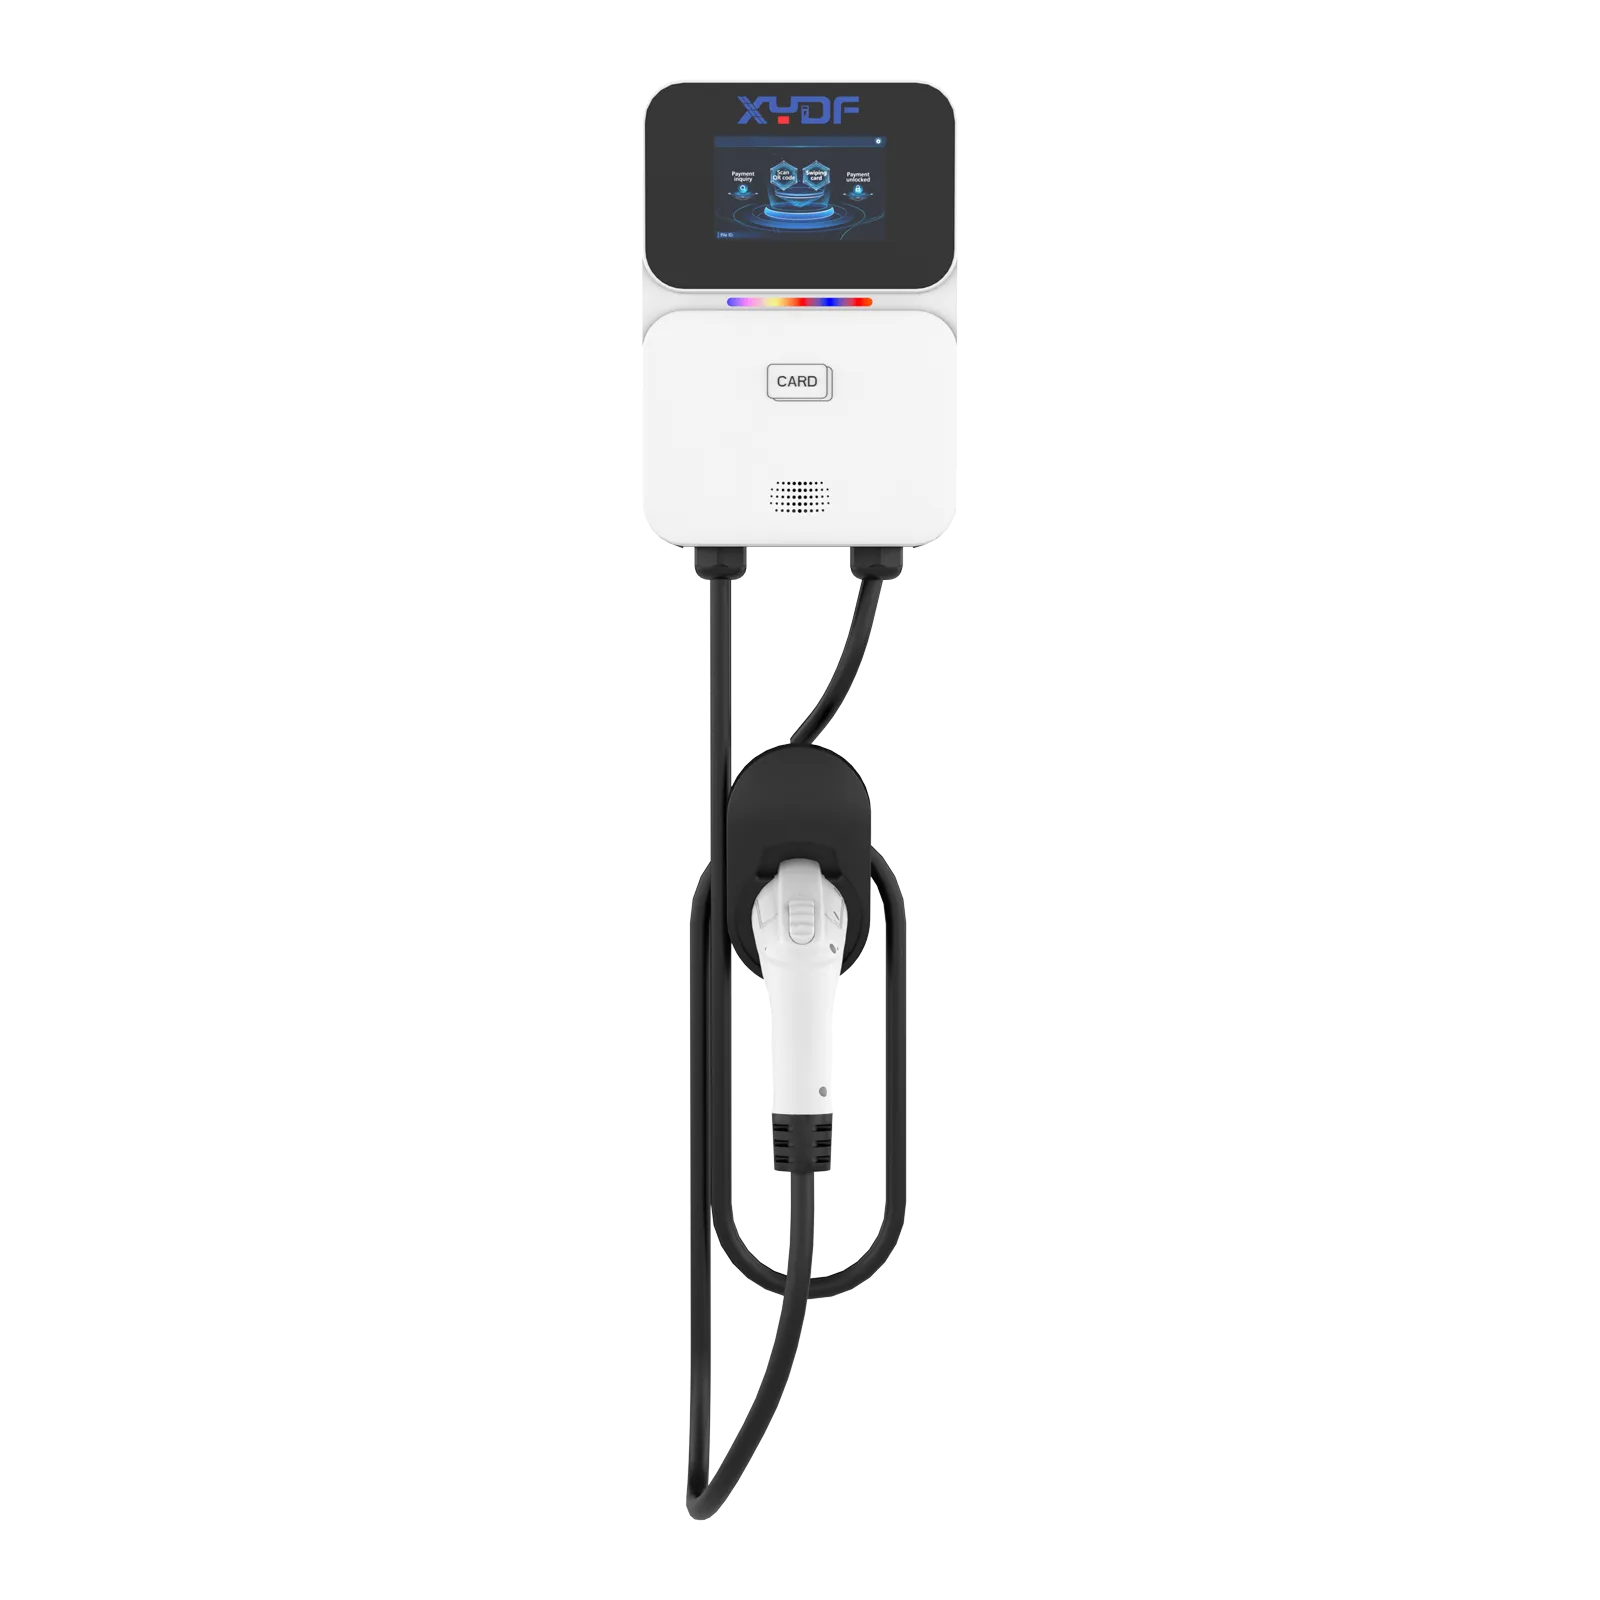
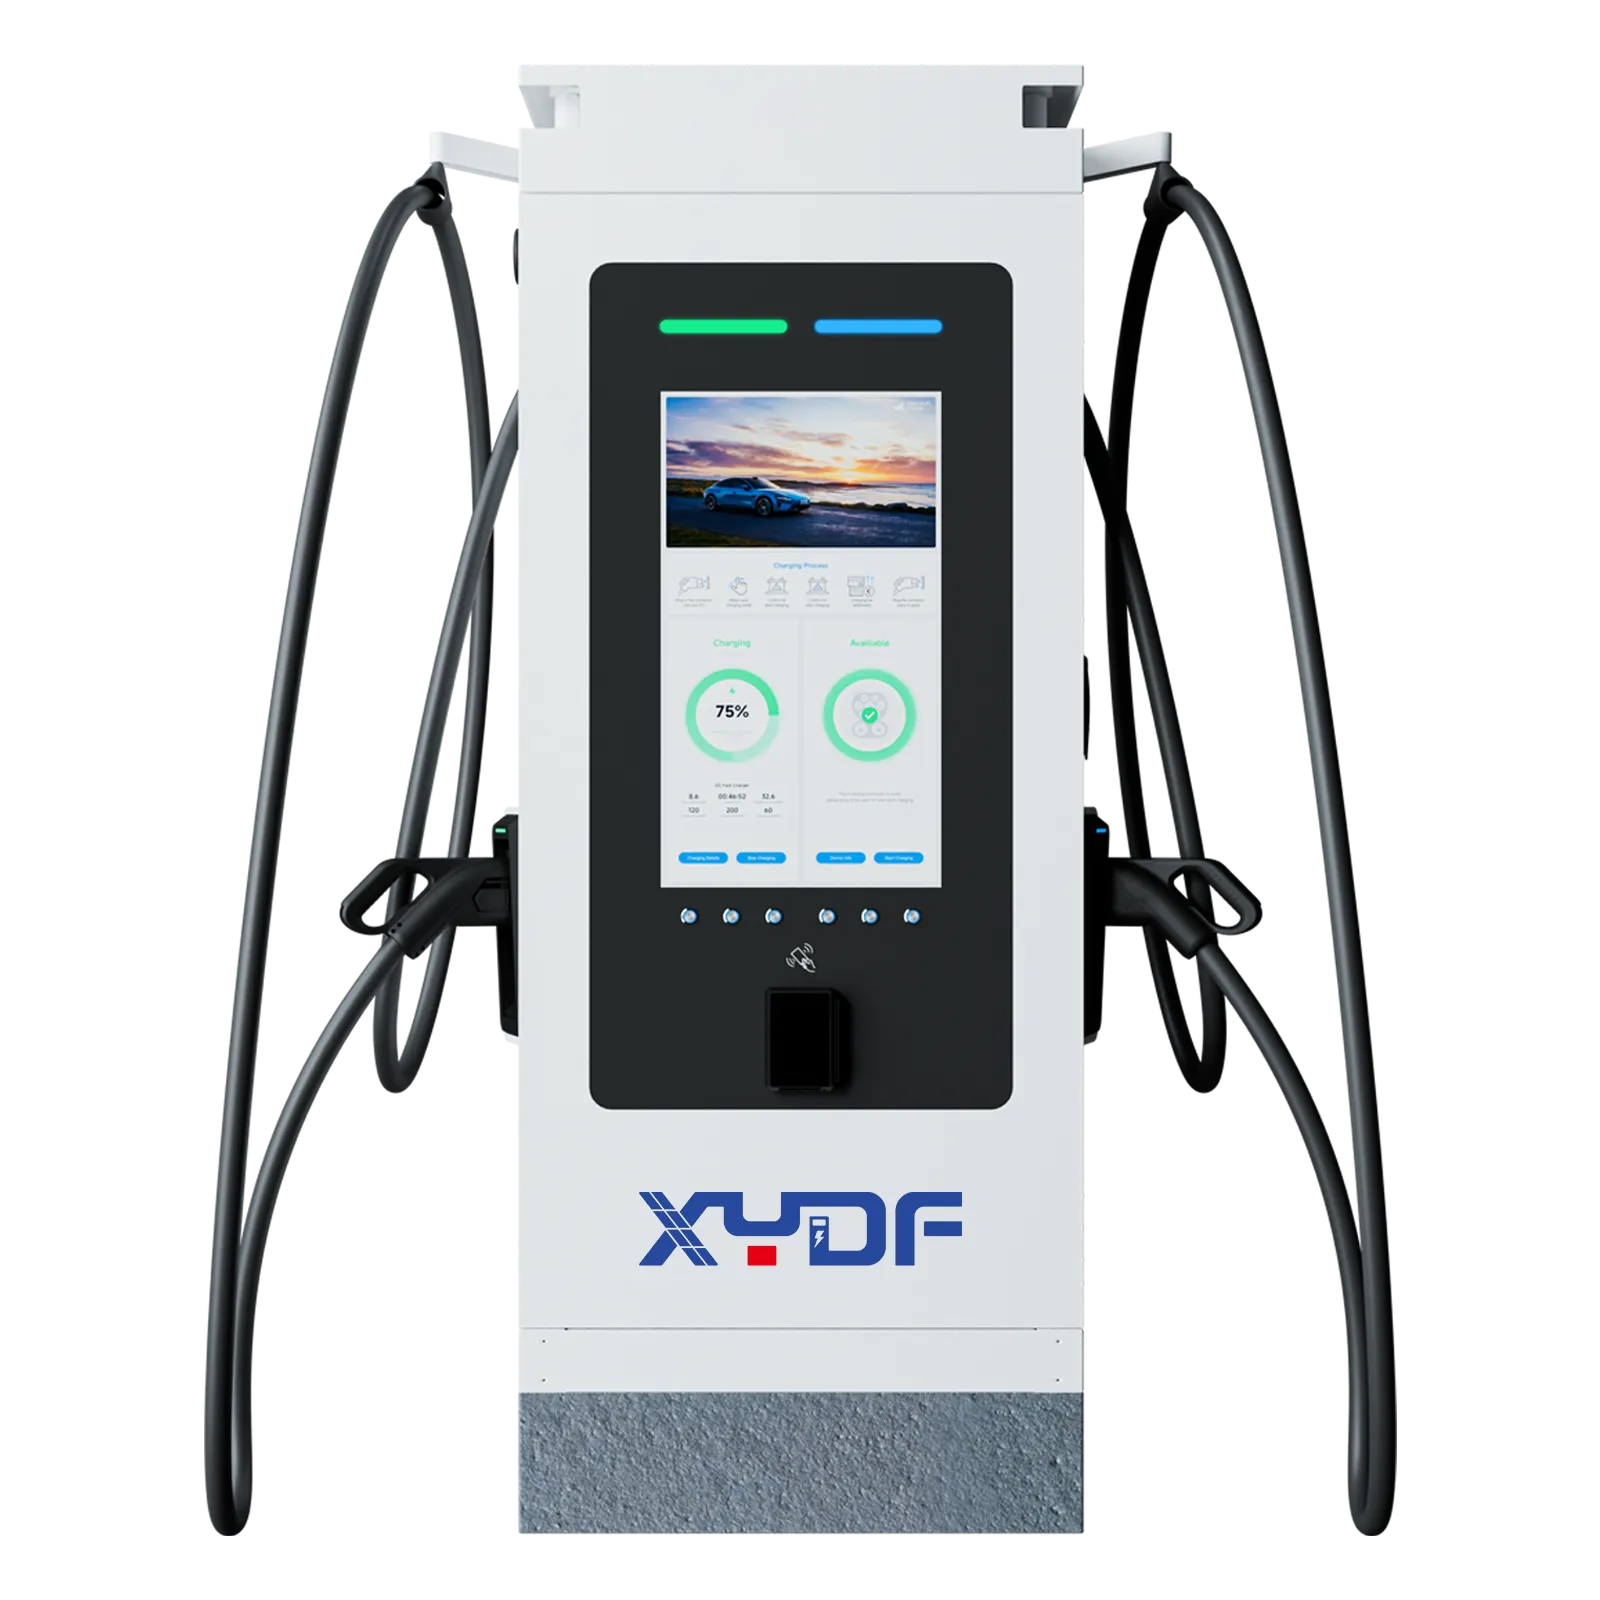
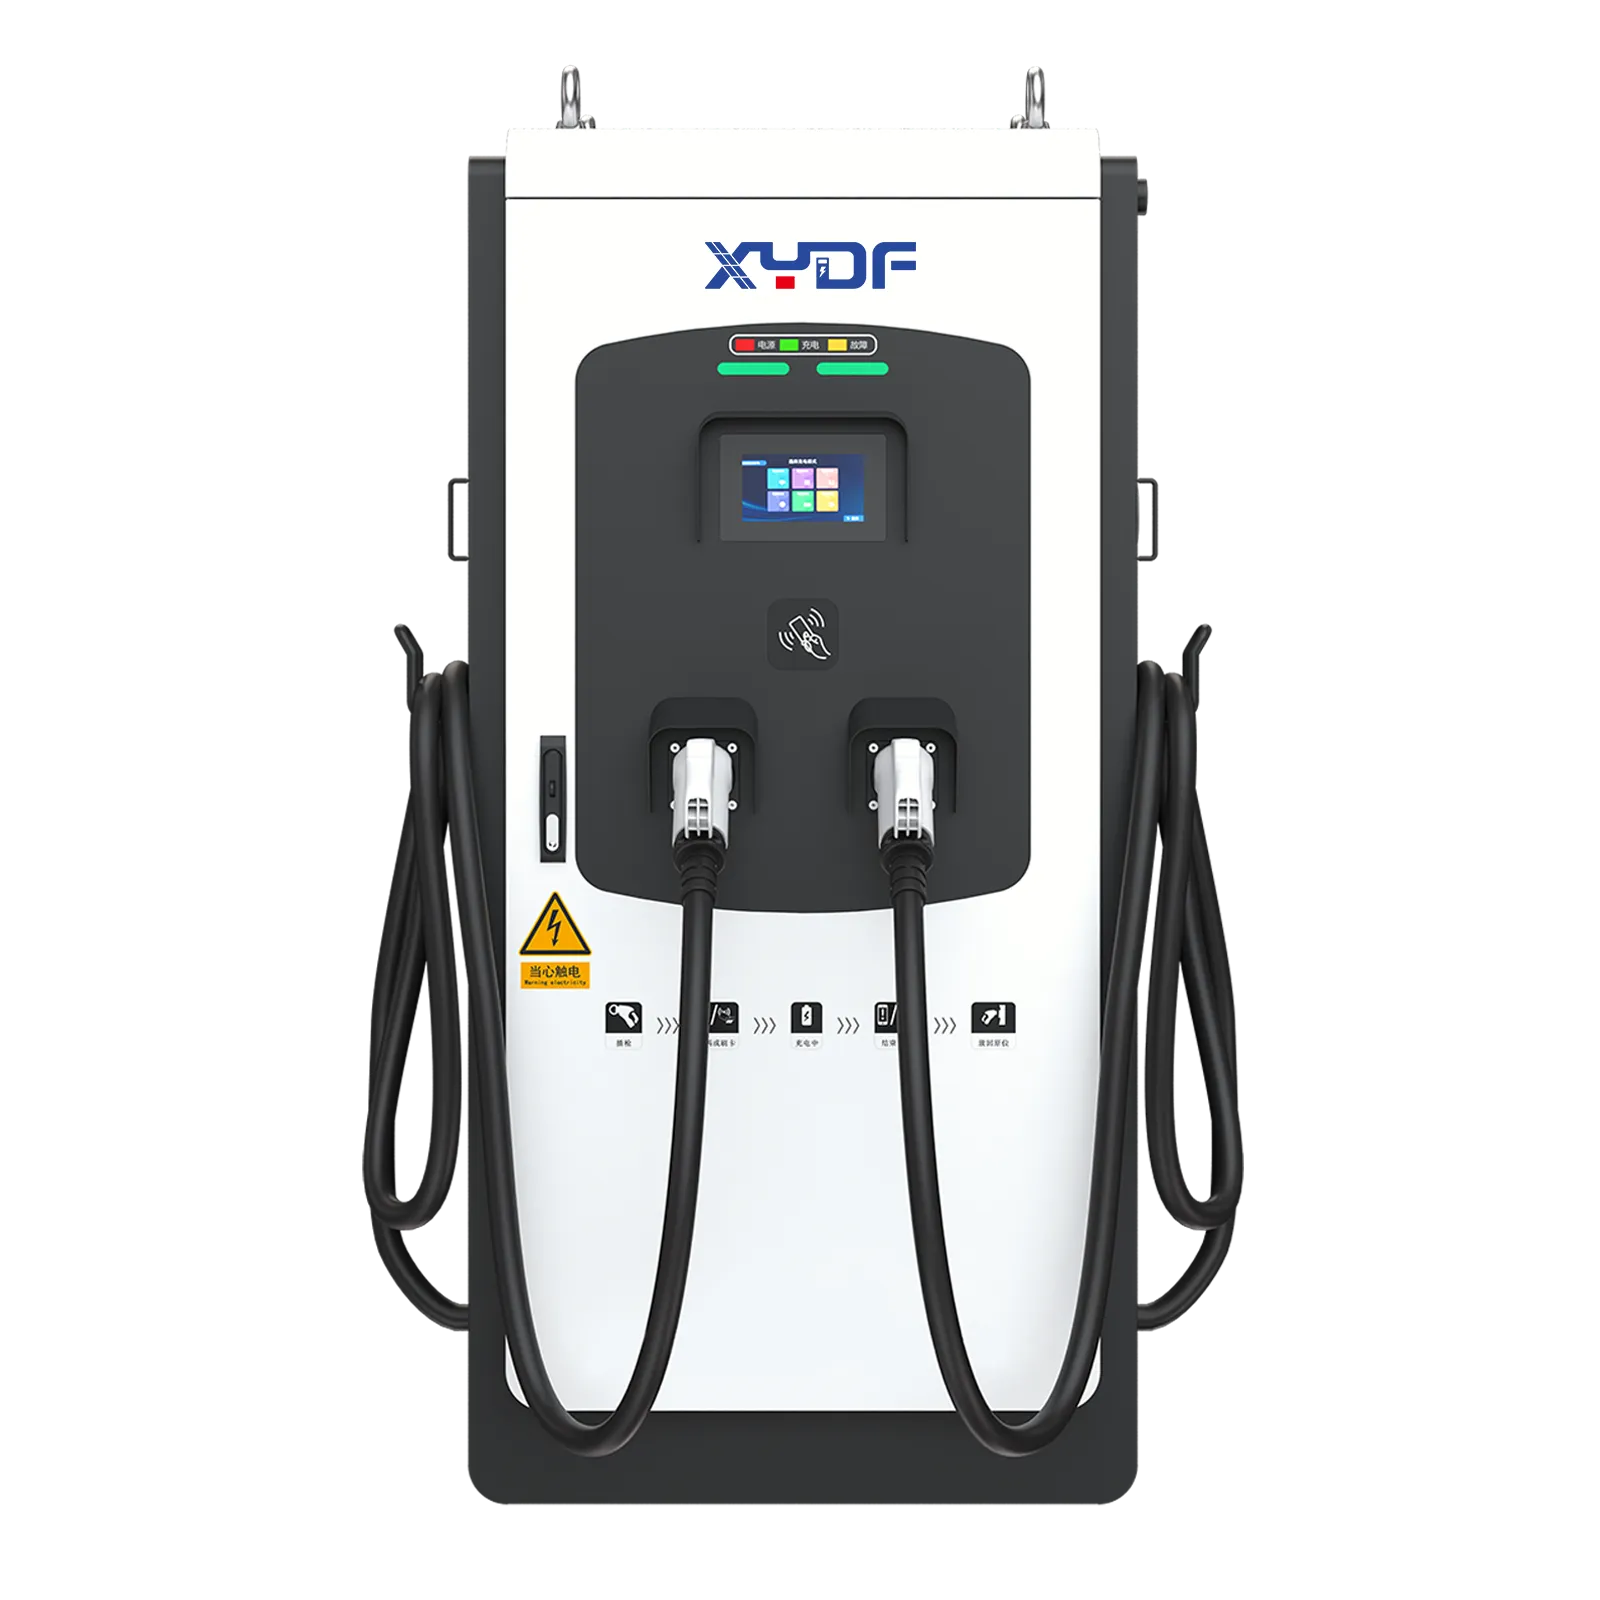
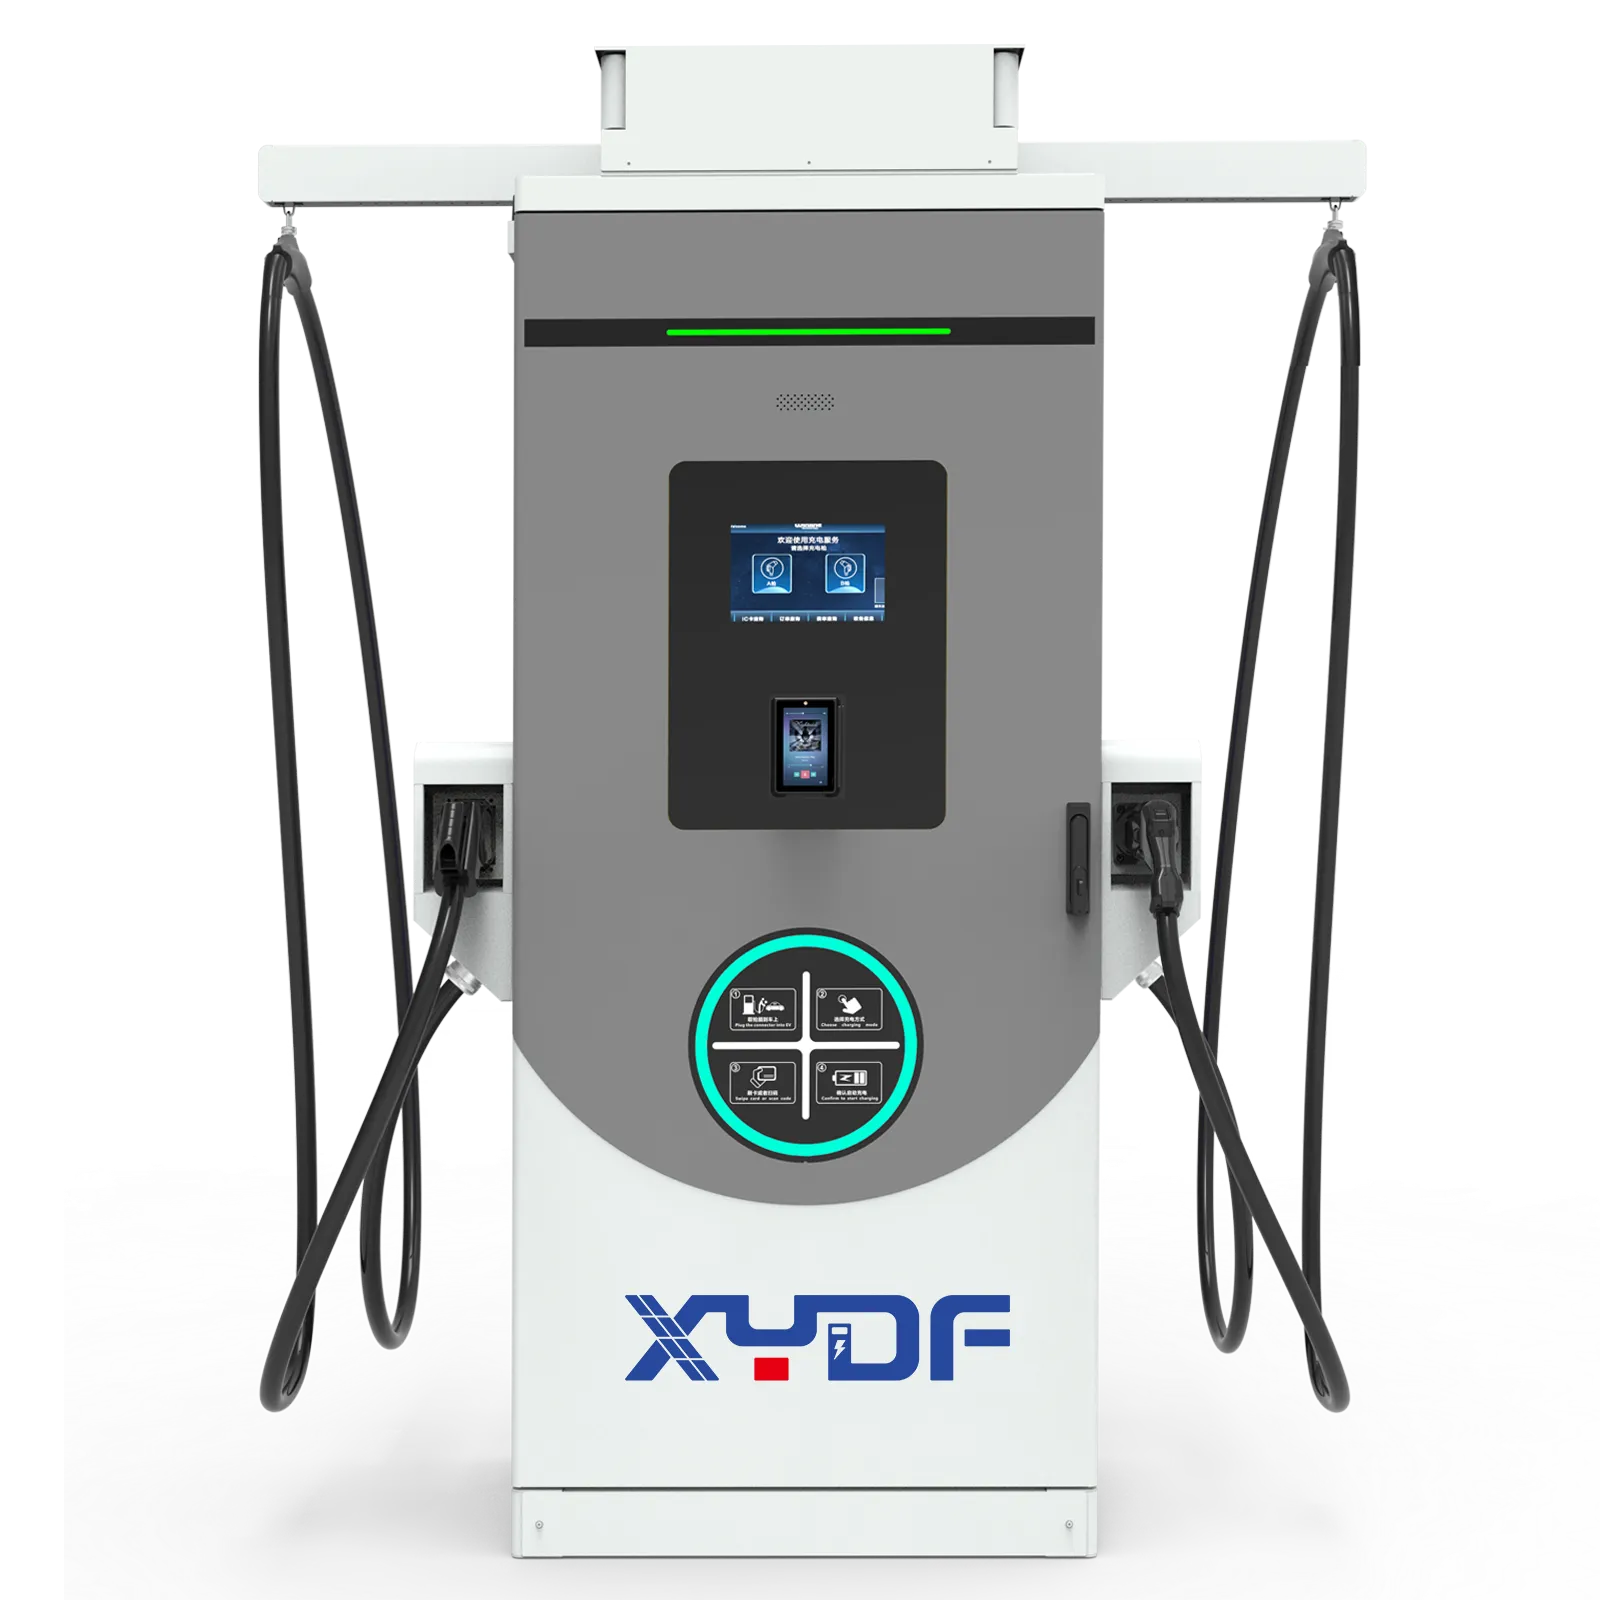
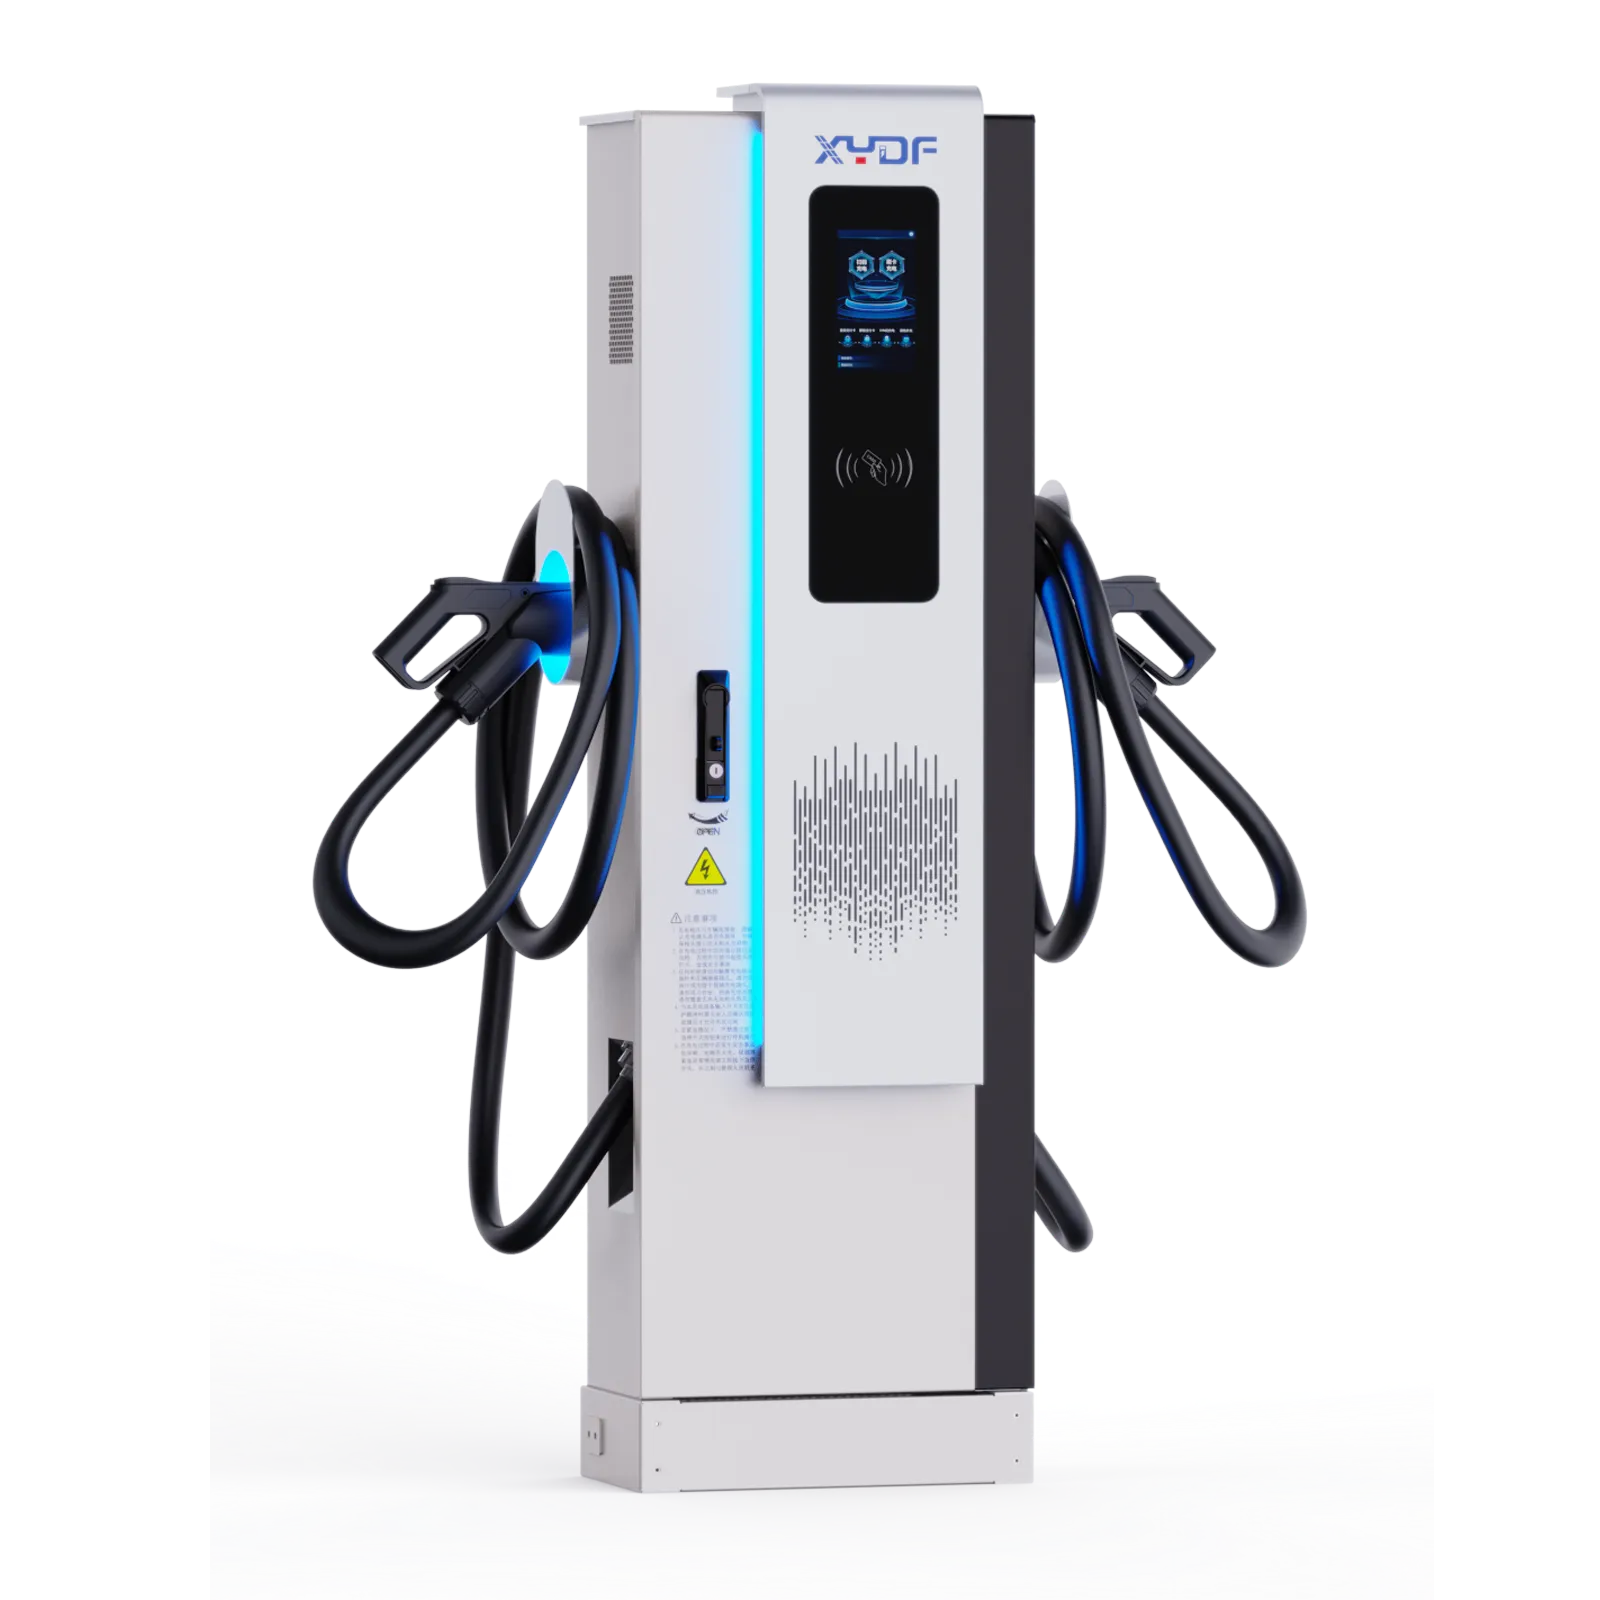
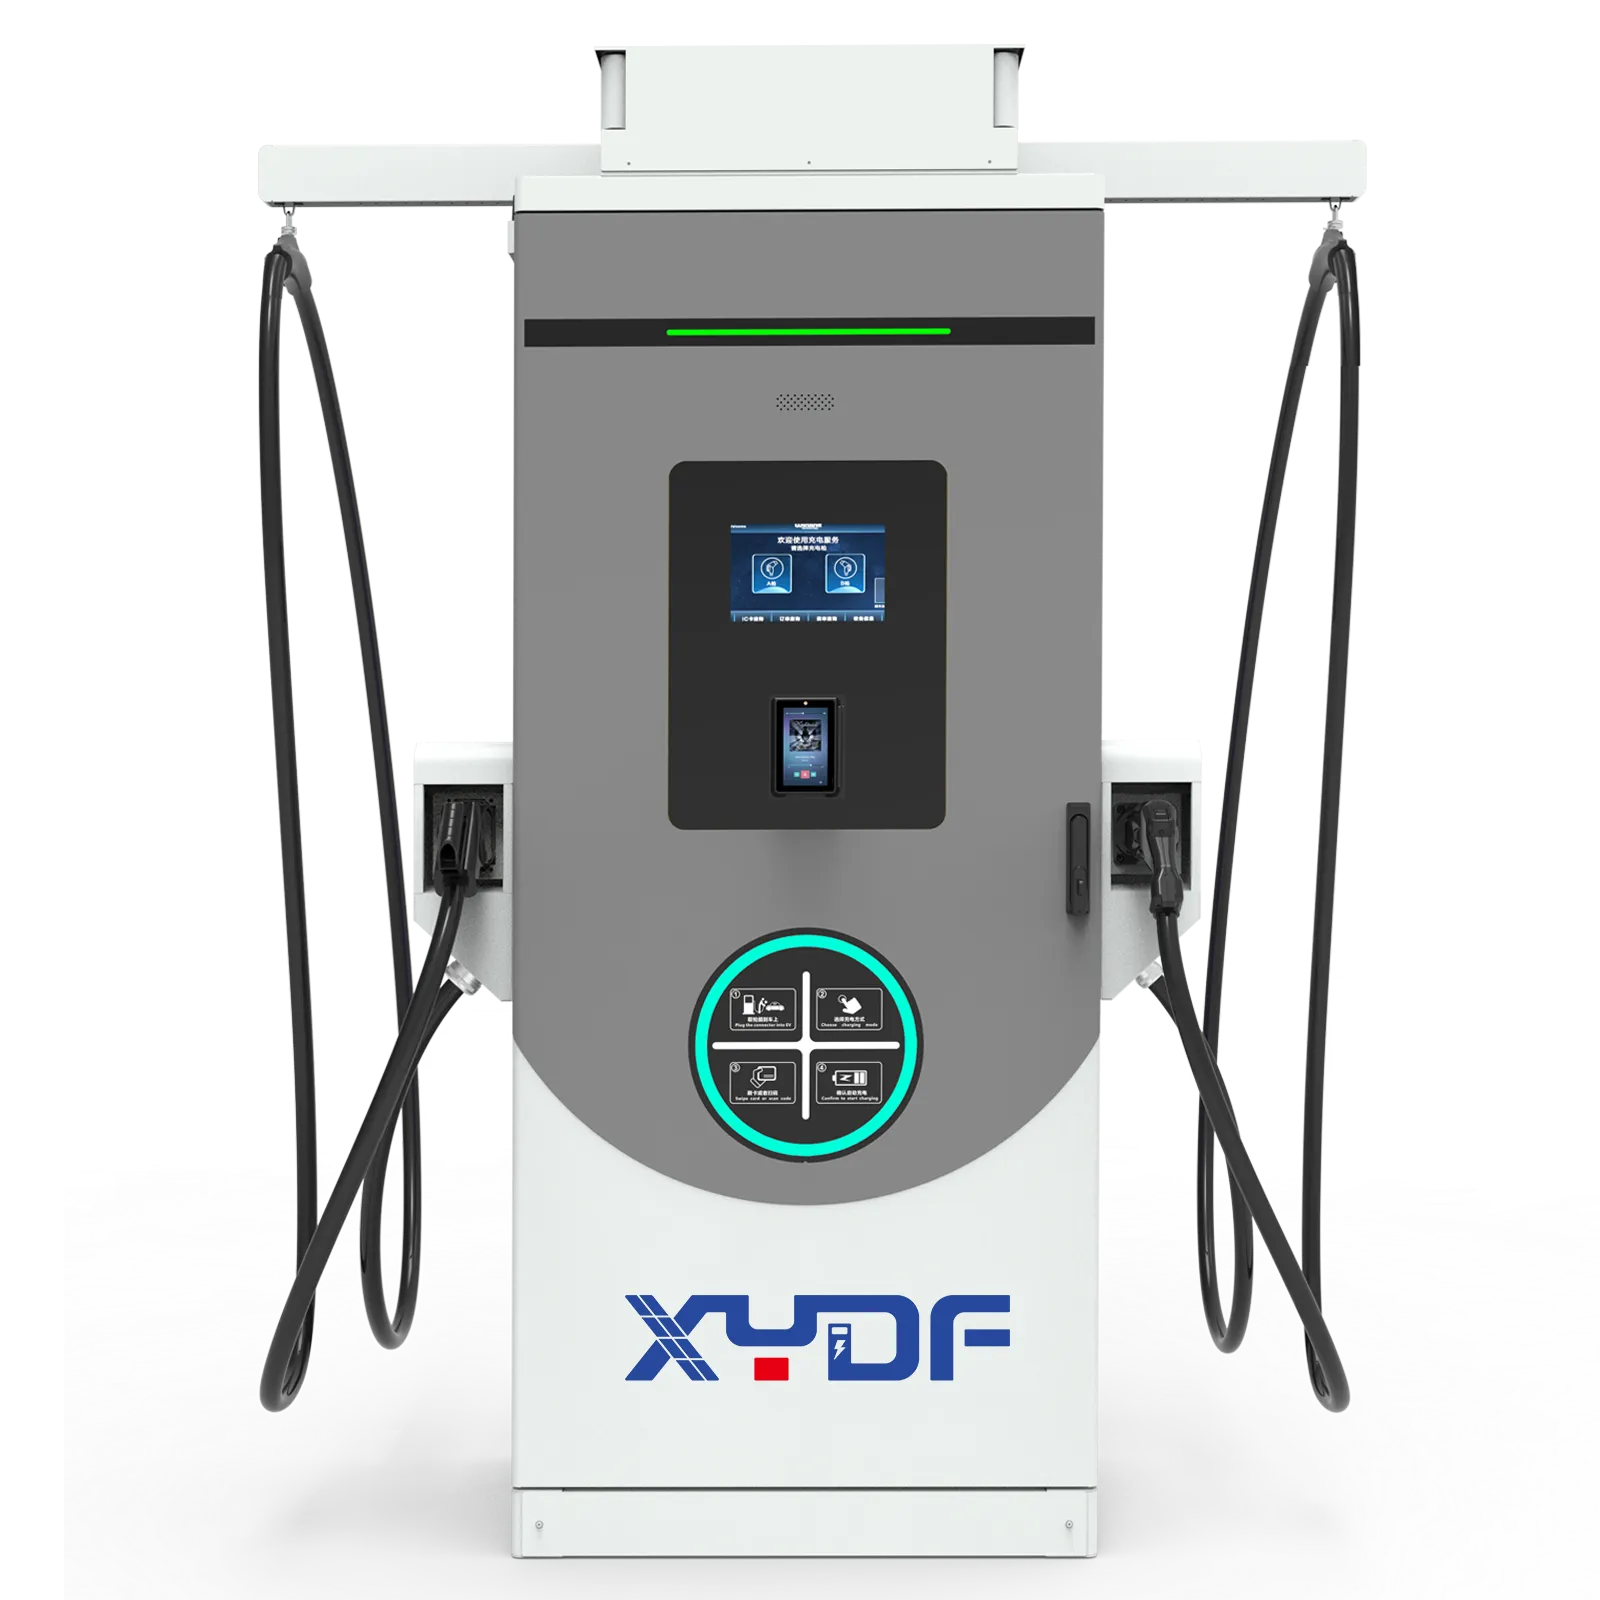
اكس واي دي اف manufactures a comprehensive range of commercial EV charging stations equipped with advanced DLB algorithms and strict OCPP 2.0.1 compliance. Engineered with global certifications (UL/CE/CCC), these systems are designed specifically to help CPOs and contractors optimize their TCO and accelerate profitability.
Which evidence gaps should procurement close?
- Ask the utility to confirm the applicable tariff, interconnection scope, expected energization date and any upstream work in writing.
- Require the site developer to provide a monthly traffic-to-session-to-kWh bridge, not only a session count or a nameplate-capacity utilization percentage.
- Request separate hardware, civil, electrical, software, payment, service and warranty schedules so costs are not omitted or counted twice.
- Match the tendered charger mix to dwell time, vehicle acceptance and simultaneous-power requirements; review available DC fast charger configurations without treating catalogue power as guaranteed site throughput.
- Before committing capital, send the load profile, connector mix, utility constraints and commercial assumptions to XYDF for a project-specific equipment discussion; commercial feasibility remains the project owner’s and advisers’ responsibility.
الأسئلة الشائعة
Are commercial EV charging stations profitable?
Yes, they can be highly profitable, but profitability depends heavily on utilization rates and energy management. Stations located in high-traffic areas that utilize dynamic pricing and load balancing to avoid utility demand charges typically see strong returns within 3 to 5 years.
How much does a commercial EV charging station cost?
The total installed cost varies widely and is significantly higher than the basic cost of home electric car charging station units due to heavy-duty hardware and grid upgrades. A Level 2 commercial station typically costs between $3,000 and $7,000 per port fully installed. A level 3 charging station (DC Fast Charger) can range from $40,000 to over $100,000 per port, factoring in hardware, trenching, and grid upgrades.
What are utility demand charges?
Demand charges are fees levied by utility companies on commercial customers based on their highest peak power draw (usually measured in 15-minute intervals) during a billing cycle. For fast chargers, these fees can sometimes exceed the actual cost of the electricity consumed.
Does Level 2 or DC Fast Charging have a better ROI?
It depends on the business model. Level 2 chargers have a lower CapEx and are excellent for locations where drivers park for hours (hotels, workplaces). DC Fast Chargers have a higher CapEx but can generate significantly more revenue per day due to high turnover rates, making them ideal for retail and highway locations.
References and source guidance
What should project teams do next?
The sticker price of the hardware rarely determines ROI on its own; power-management strategy, utility demand charges, trenching, and longer-term infrastructure and software decisions also shape project economics. Contractors that omit those items can overstate projected returns. When discussing a project with XYDF, include load-balancing requirements and open-protocol needs in the specification. Explore the XYDF product range and share the site requirements for review.
The practical rule is simple: forecast energy that the site can actually deliver and bill, then place every related cash flow in the month when it occurs.
 شركة شينيا دونغفانغ لتكنولوجيا الكهرباء المحدودة.