Calculating Utilisation for an EV Charging Station Business Model
Авг 25,2026
Блог
Charging-station utilisation is easy to misread. A connector that is occupied for many hours may be delivering little energy, while a high-power bay can produce strong revenue in short sessions and still face a costly evening demand peak. Counting connectors or quoting a network-wide percentage does not tell an investor whether a site can cover electricity, demand charges, payment fees, maintenance, and fixed costs. This guide separates time utilisation, energy utilisation, uptime, and contribution margin, then links each measure to dwell time, traffic, grid capacity, and pricing. The goal is a business-case method that can be tested against interval data and failed-session records before a team commits to extra chargers or a new site.
The short answer is that utilisation should be calculated at connector level and separated into time connected, energy delivered, successful-session rate, and uptime. Pair those measures with a contribution-margin model that includes electricity, demand charges, payment fees, software, maintenance, site rent, and capital recovery. A 15-minute interval profile is more useful than a single monthly average because it reveals peak demand and quiet periods. Before expansion, test whether weak utilisation comes from low demand, poor access, faults, pricing, or a mismatch between dwell time and power.
Utilisation can mean active charging time ÷ available time, or kWh delivered ÷ theoretical maximum output. The first shows customer behaviour; the second shows power effect. The International Energy Agency notes that charging needs differ by use case, so one network-wide target is a poor investment test.
Match commercial charging economics to the site’s operating pattern.
What utilisation number should a charging site track?
For each connector, calculate active charging minutes ÷ available minutes. Exclude verified planned maintenance, but include customer-facing outages; otherwise utilisation improves on paper while revenue is lost. Pair it with uptime—successful service time ÷ scheduled service time—and failed-session reasons. Eight percent active time at 90% uptime is a different case from the same activity at 99% uptime.
Keep four measures separate in the model: connected-time utilisation, energy utilisation, connector availability, and successful-session rate. They answer different questions. A low energy percentage may be normal at a long-dwell workplace, while a high connected-time percentage can conceal idle vehicles or a connector that is occupied but not delivering energy. Report the measurement window, excluded maintenance periods, connector count, and whether the denominator is scheduled service time or installed time before comparing sites.
Use 15-minute interval data where available, grouping sessions by hour, day type, connector, customer class and kWh. Compare the same period year over year. For Melbourne, ask whether quiet hours reflect normal dwell time, payment friction or weak visibility—not one slow week.
Illustrative calculation: a 150 kW connector available for 720 monthly hours delivers 9,000 kWh. Energy-based utilisation is 9,000 ÷ (150 × 720), or 8.3%. A short evening peak may still create costly demand. Confirm actual billing demand, diversity and tariff rules with the local retailer or network provider.
How do dwell time, traffic, and grid capacity change utilisation?
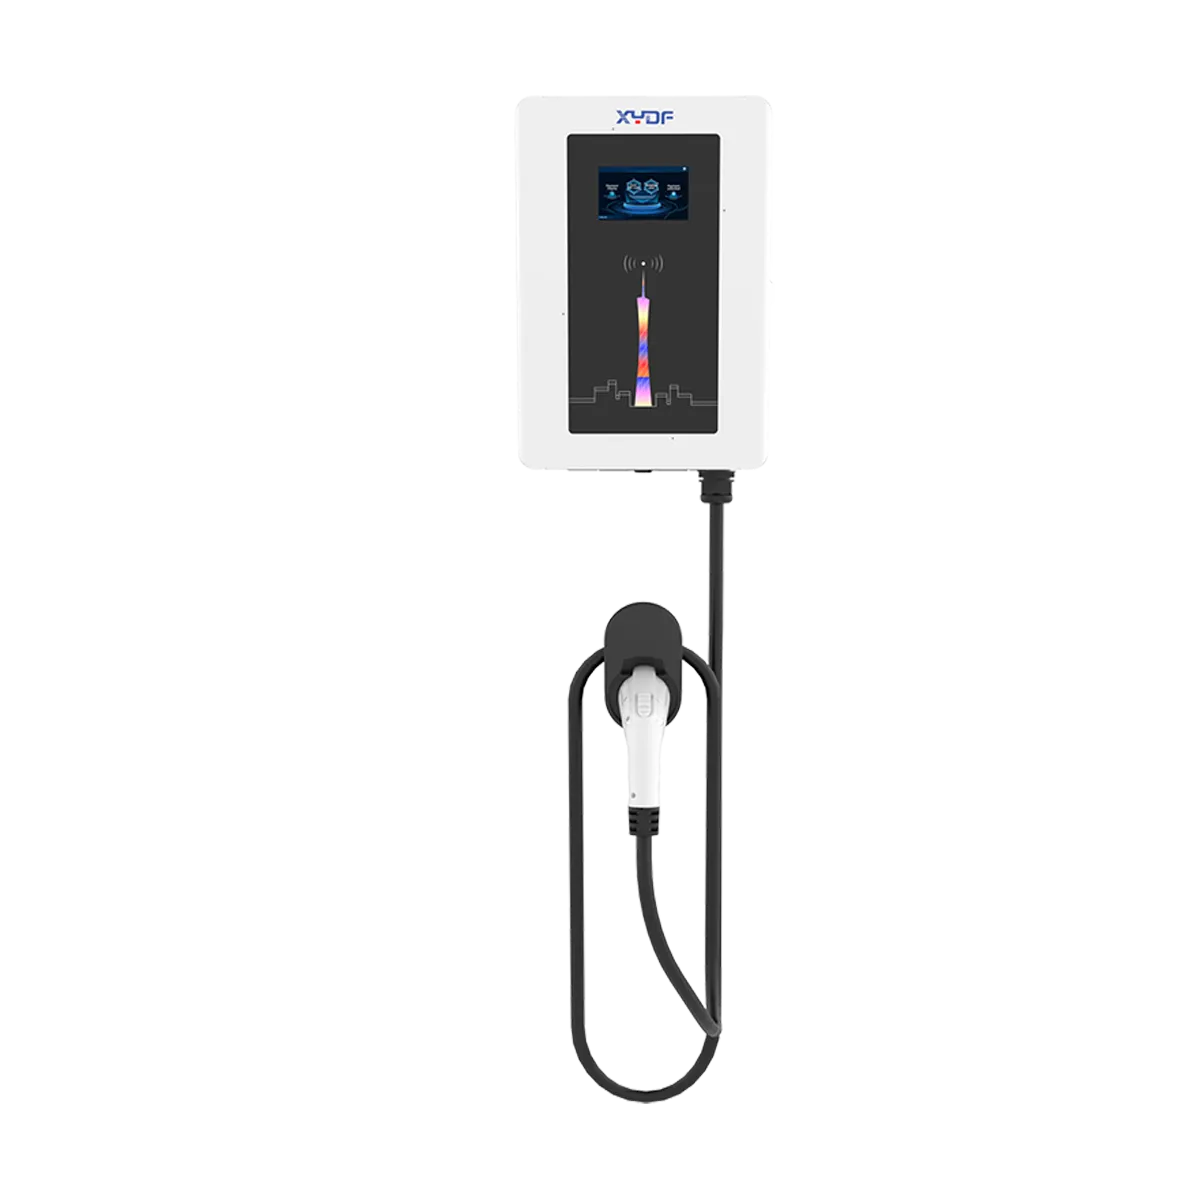
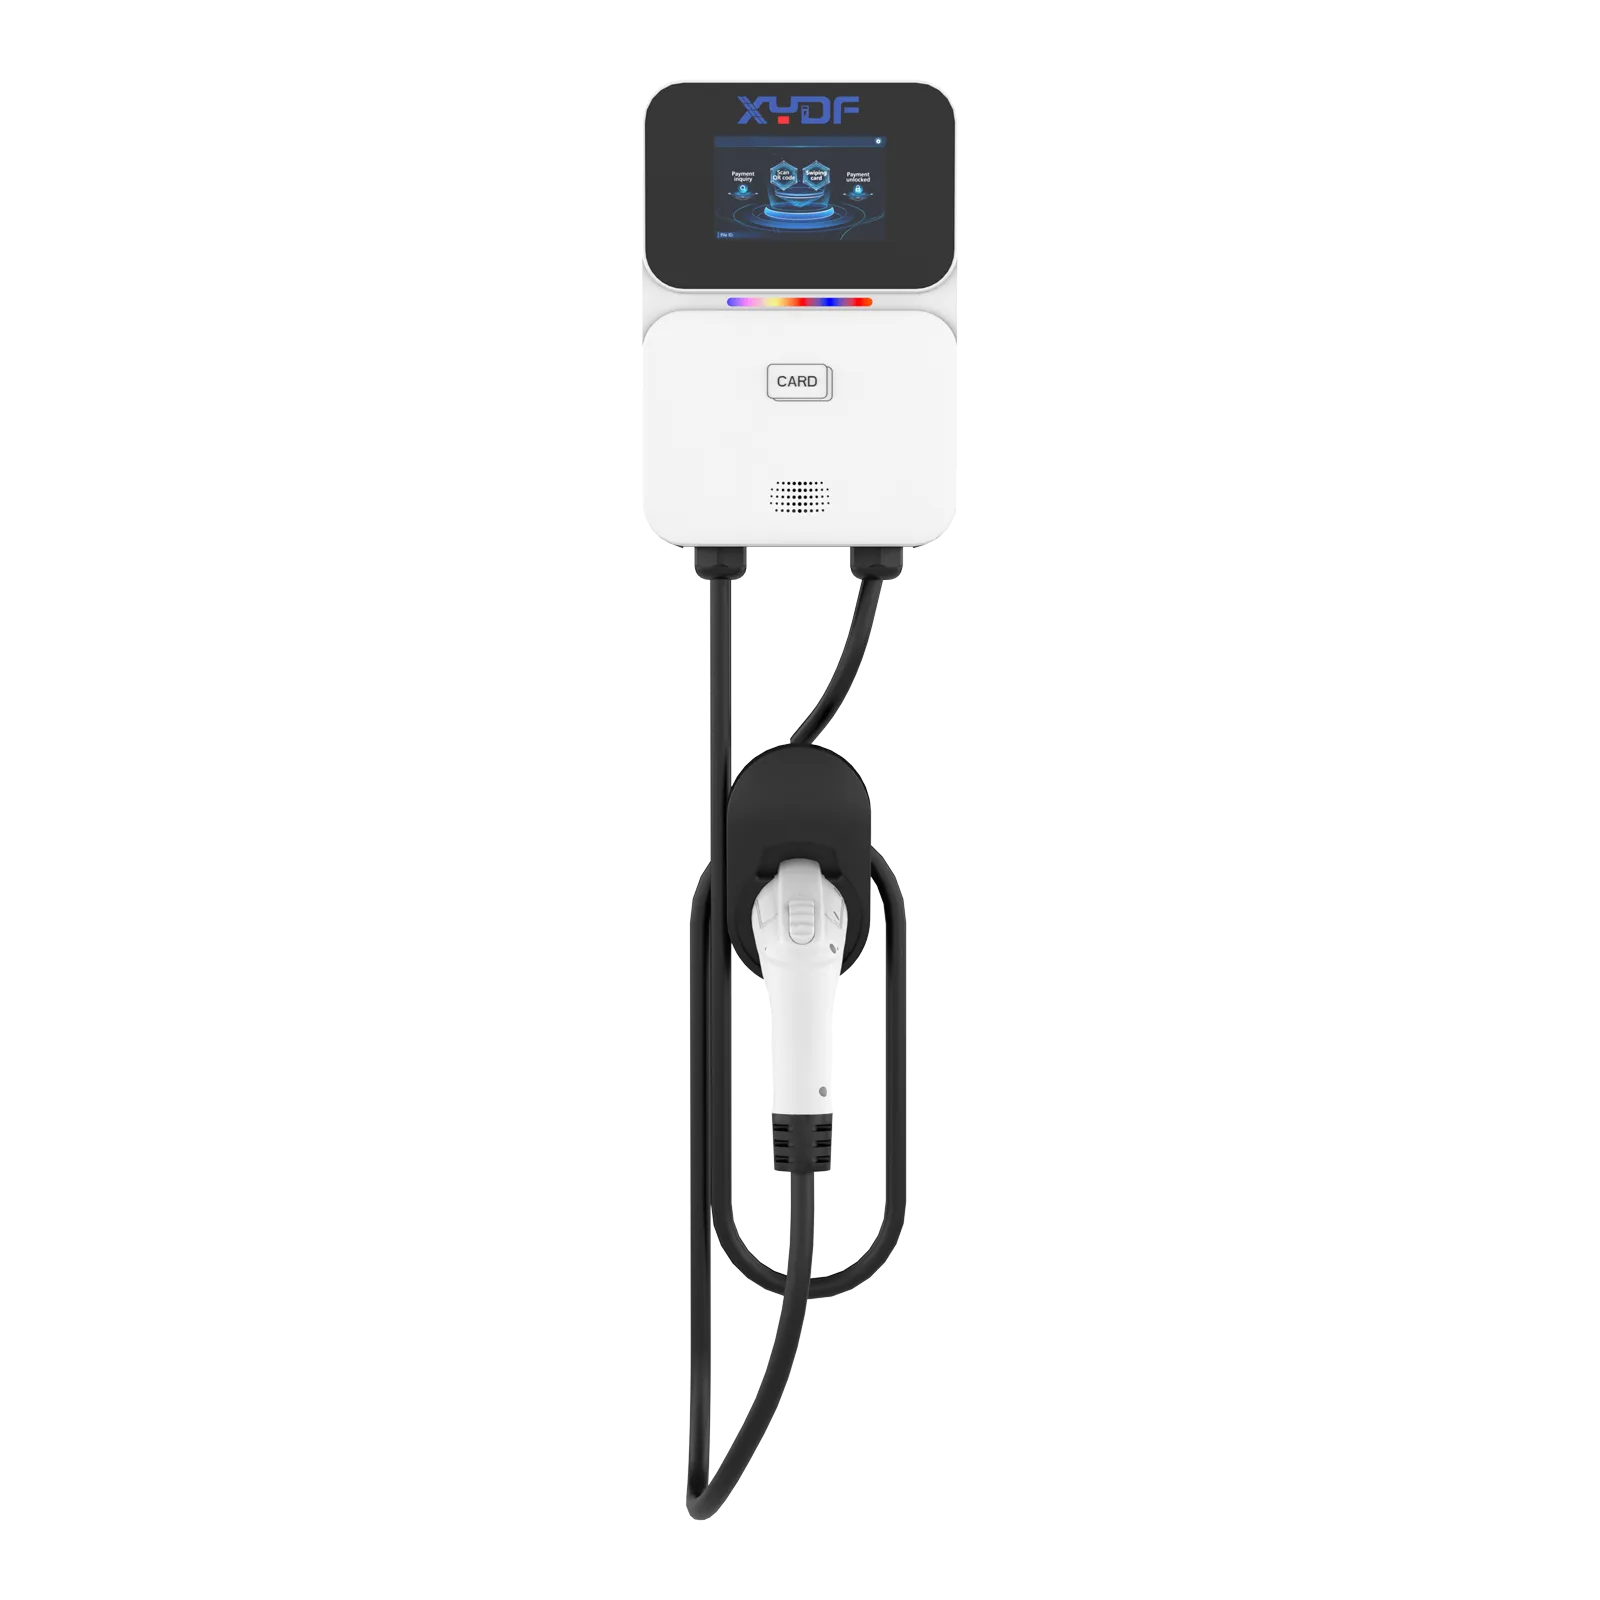
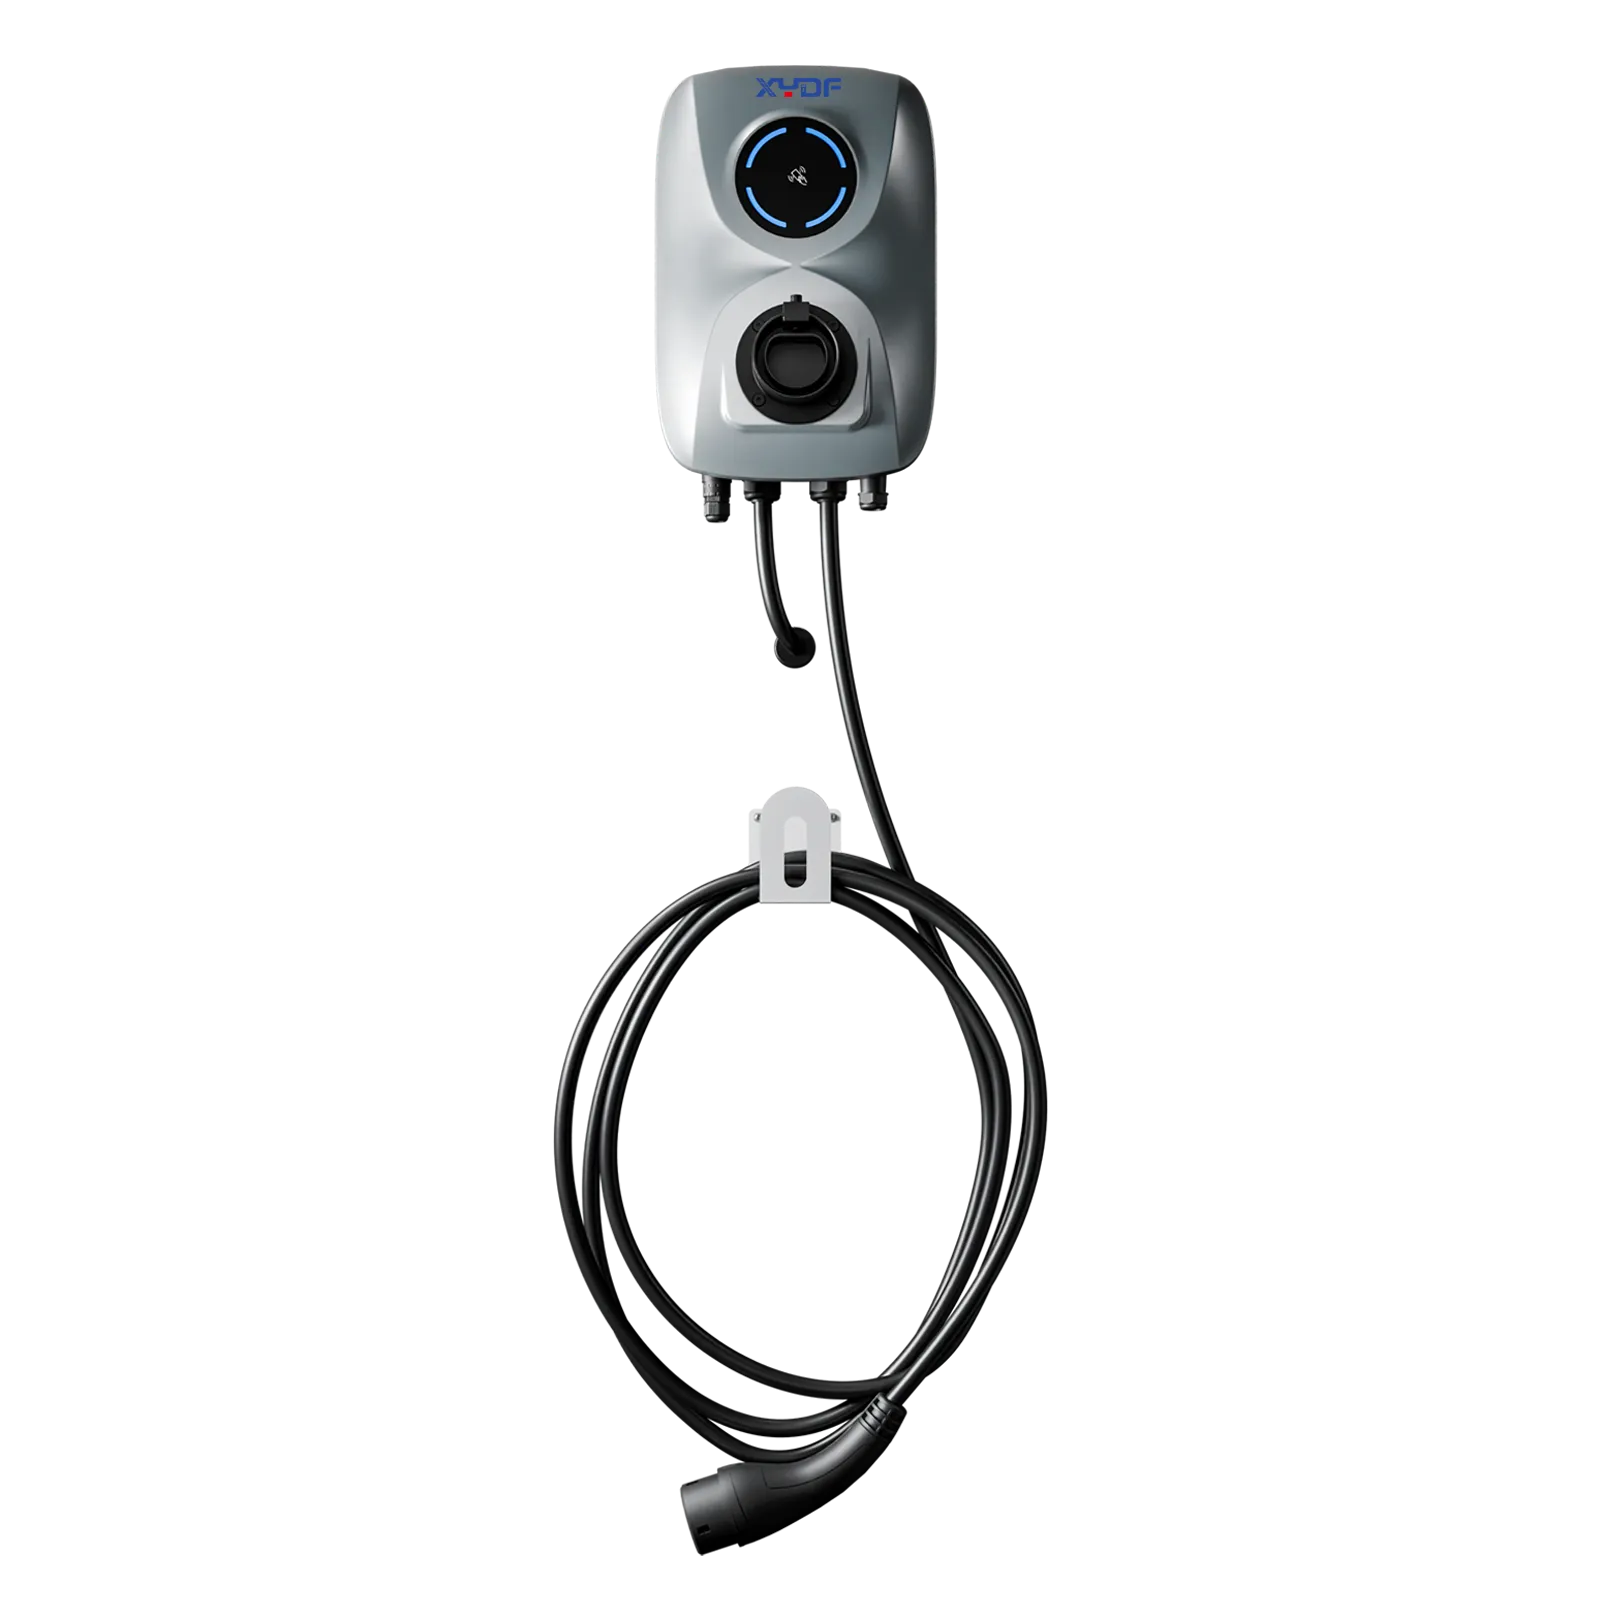
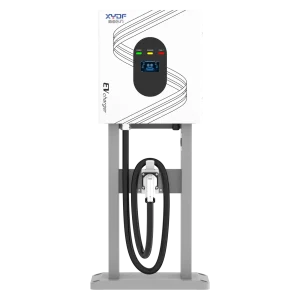
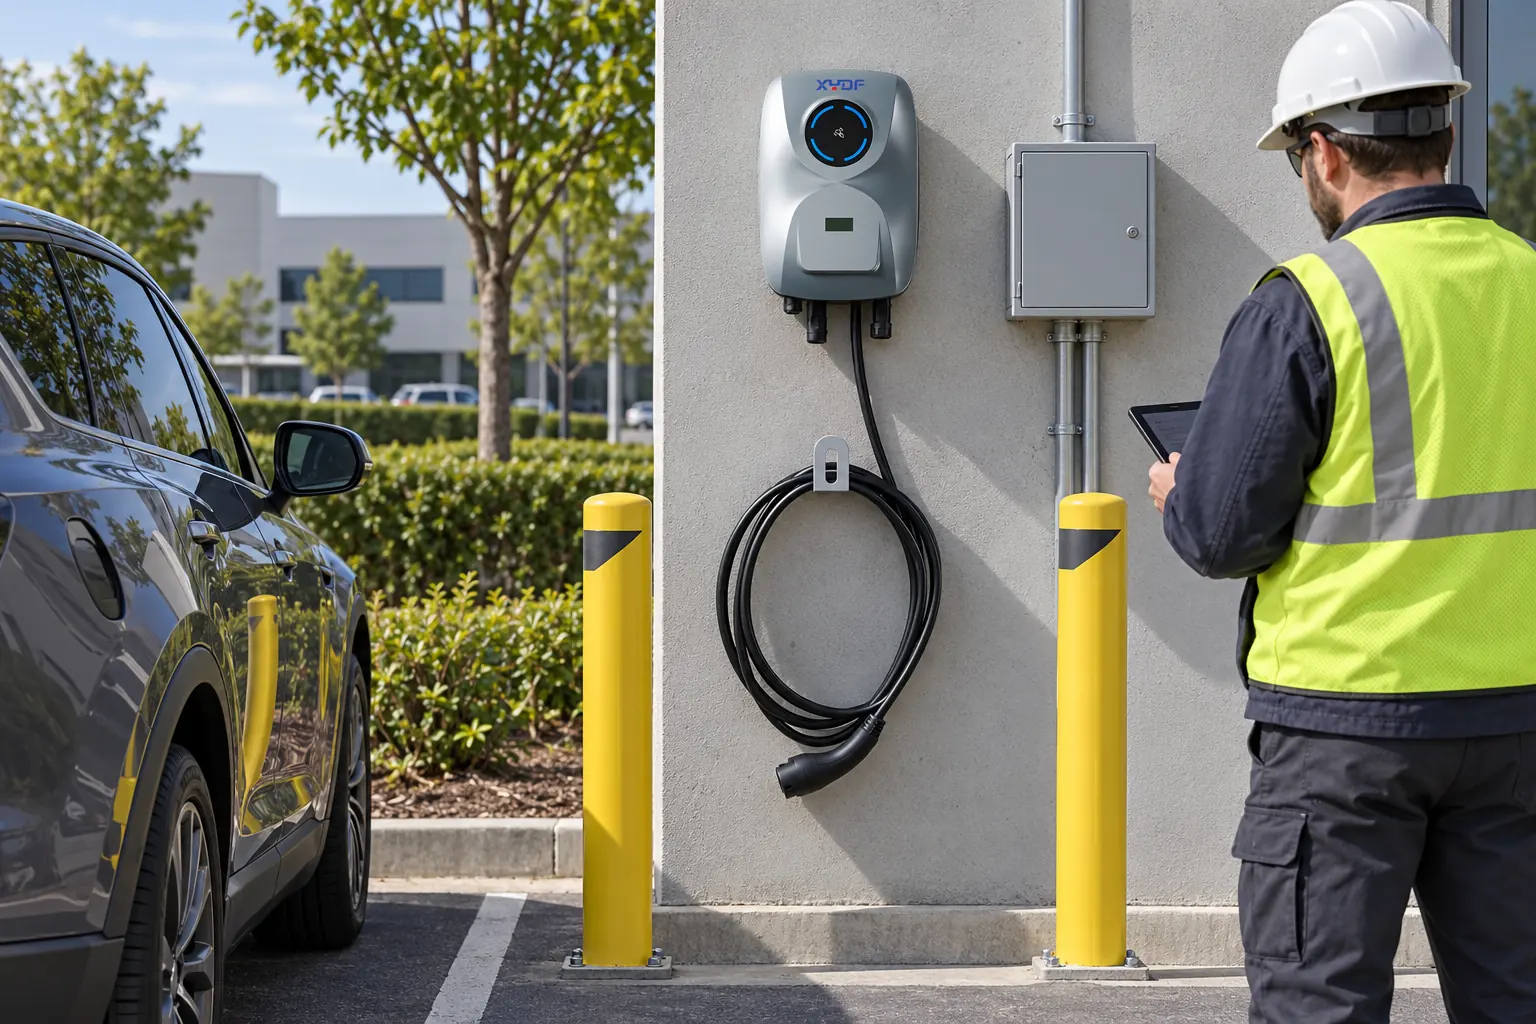
Site selection begins with the charging job. Workplaces, hotels and multi-hour destinations often suit managed AC charging; highway, depot and high-turnover retail locations may need DC power and circulation space. Review vehicle mix, arrivals, nearby alternatives, parking enforcement and safe access alongside traffic counts. An Зарядное устройство переменного тока can use long parking periods without forcing an unused high-power connection.
Grid capacity is a commercial constraint. Obtain connection capacity, transformer loading, import/export settings and upgrade lead time. Where solar or storage is considered, model it against the coincident charging peak, not annual generation alone; see this guide to проектирование зарядной станции на солнечных батареях и аккумуляторах.
Site pattern
Likely charging approach
Utilisation signal to test
Primary risk
Workplace or hotel
AC, scheduled or managed access
Long connected time; regular weekday demand
Vehicles occupying bays after charging
Retail destination
AC or moderate DC, depending on dwell time
Repeat visits and peak-hour turnover
Tariff peaks that exceed margin
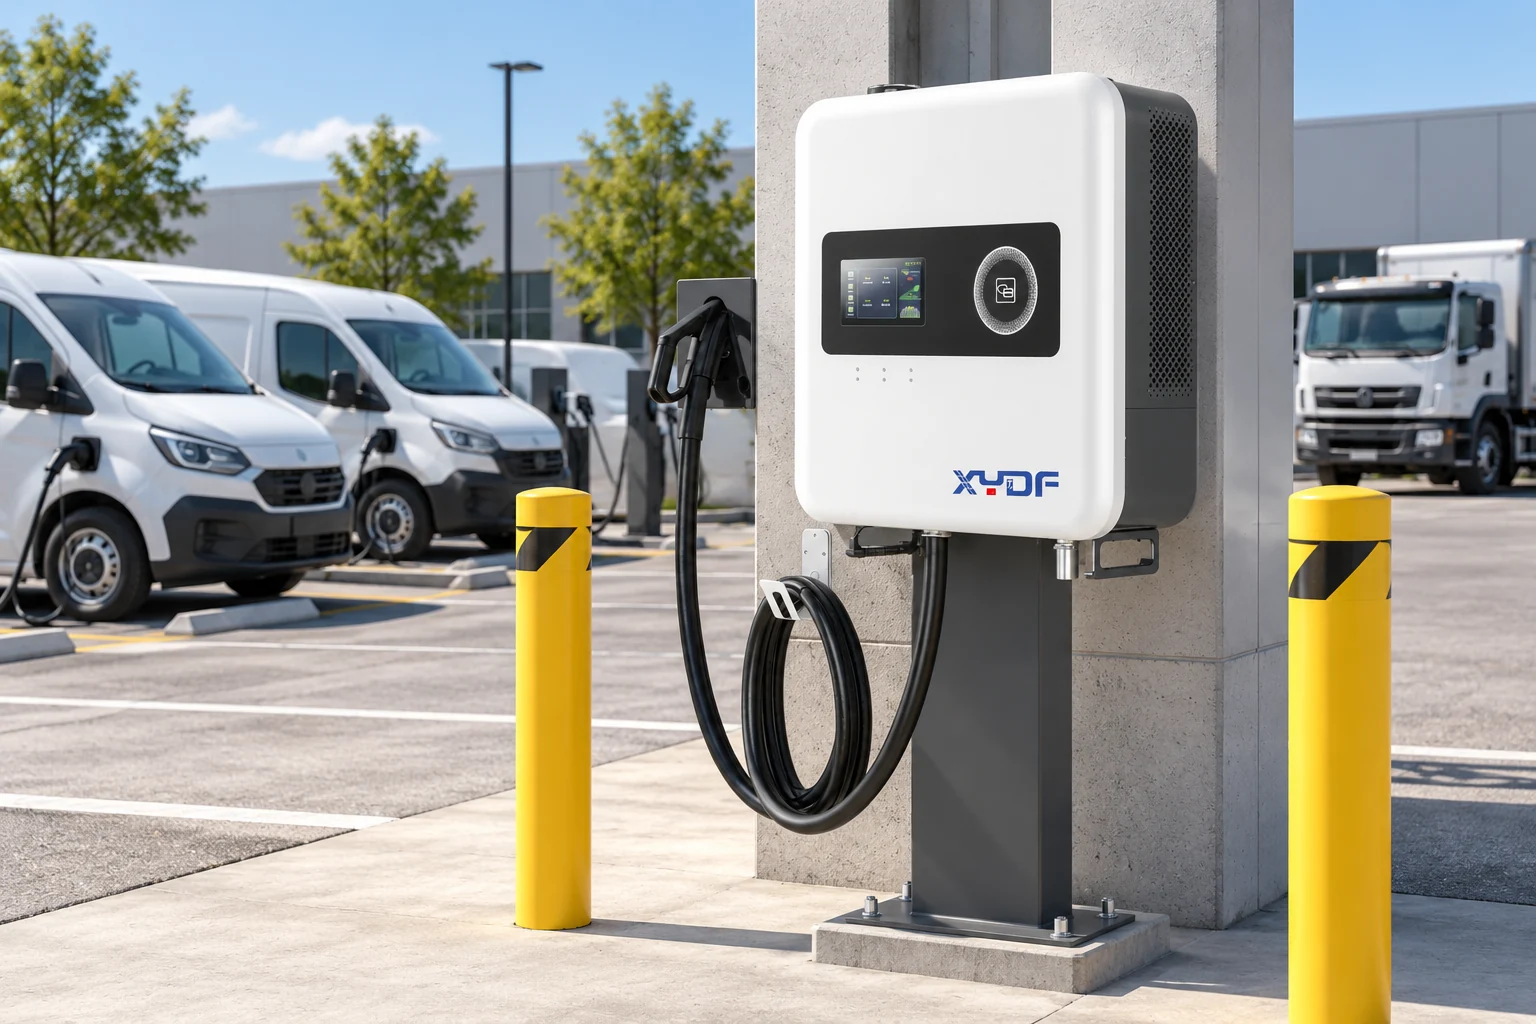
Депо флота
Managed AC/DC matched to routes
Energy per vehicle and departure readiness
Simultaneous charging at shift change
Transit corridor
DC with clear wayfinding
Sessions per day and queue/abandonment rate
Capital tied up in low off-peak use
How do you turn utilisation into a business case?
CAPEX includes equipment, civil works, switchboard changes, cabling, commissioning and possible grid upgrades. OPEX includes electricity, demand charges, site rent or revenue share, payment processing, software, support and maintenance. Treat incentives as conditional cash flows: verify eligibility, reporting duties, timing and whether a grant changes usable connection capacity.
Revenue may come from energy sales, time fees, parking integration, fleet subscriptions, host fees, roaming or managed service. A retail host may value customer dwell; a fleet operator may value avoided downtime. A EV charging station business model must identify who captures value, carries electricity risk and pays for upgrades.
Sensitivity driver
What to model
Decision implication
Sessions
Base, downside and ramp-up cases by daypart
Stage deployment if early volume is uncertain
kWh per session
Vehicle mix, dwell time and power limits
Do not infer energy sales from connector count
Время безотказной работы
Lost sessions, support cost and repeat use
Fund monitoring and service response
Плата за мощность
Monthly coincident peak and tariff windows
Consider load management before oversizing supply
Price
Customer elasticity, competition and payment fees
Test margin after taxes and transaction costs
Calculate contribution margin per session, then subtract fixed site and network costs to find break-even utilisation. Model ROI over asset life with maintenance and replacement allowances, plus a slower ramp-up case. Practices in uptime monitoring and failed-session prevention can turn operational evidence into a defensible revenue forecast.
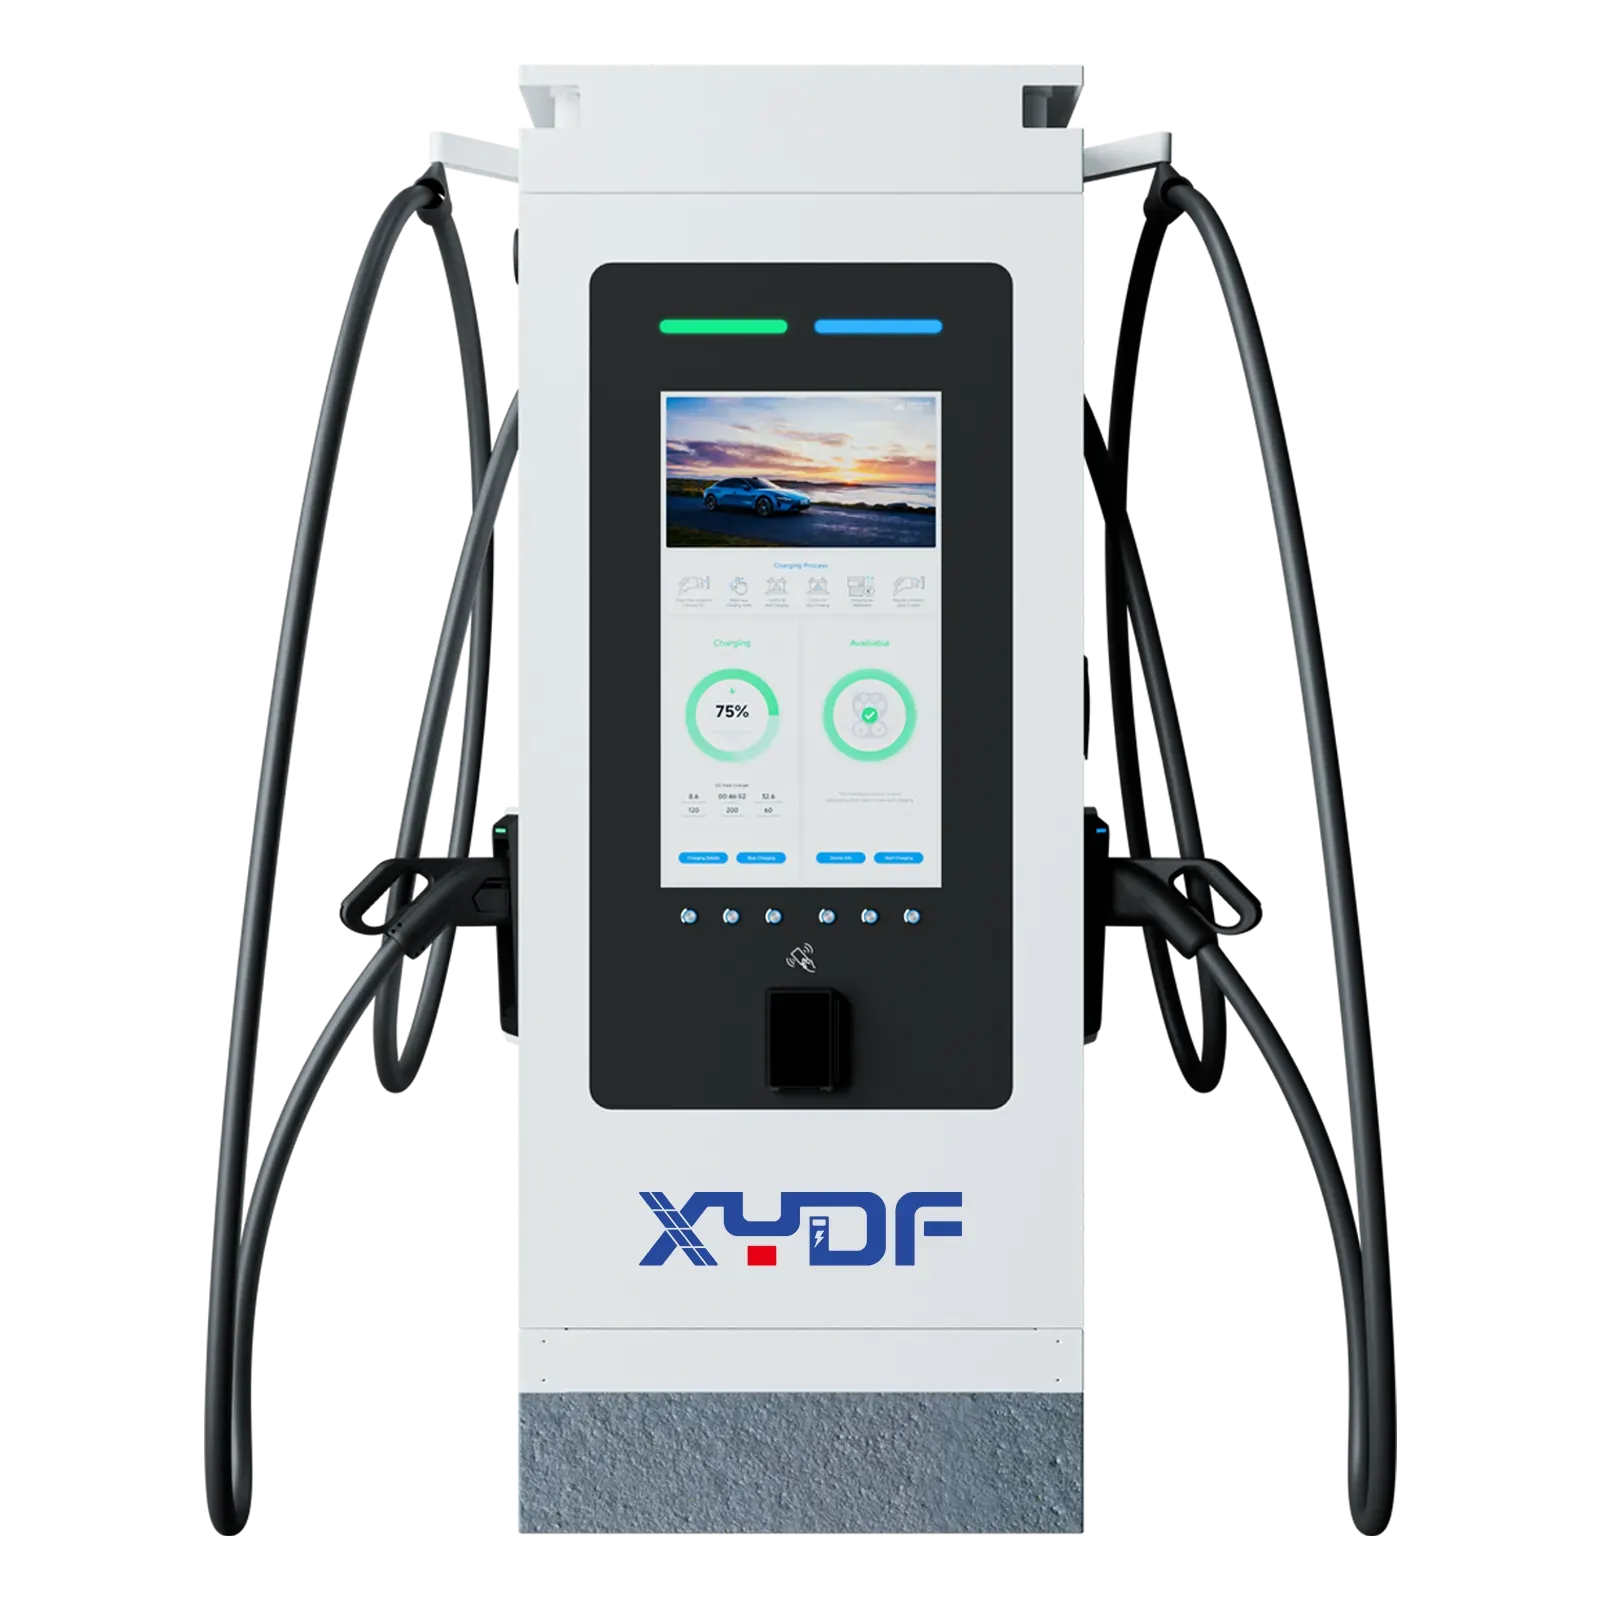
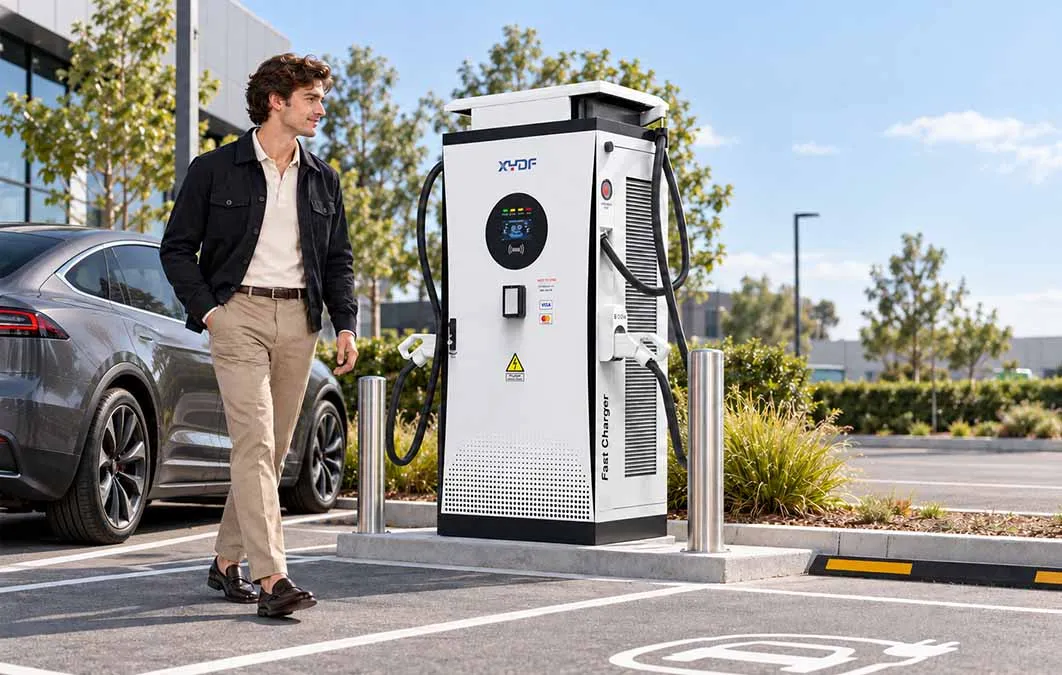
Specify high-power equipment against throughput, grid capacity and tariff exposure.
Which pricing and operating choices protect repeat demand?
Publish energy price, time fee, idle fee, parking fee, tax treatment and roaming conditions before a driver plugs in. Provide local payment methods, reconcile payments against charge sessions, and use a back office that reports sessions, faults, tariffs and remote actions. Open Charge Point Protocol (OCPP) is a communications protocol, not a guarantee that every feature works identically; confirm the version and tested functions in procurement.
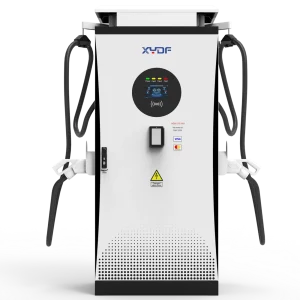
Specify fault alerts, escalation ownership, spare parts and service-level reporting. IEC 61851 addresses conductive charging-system requirements, while ISO 15118 covers vehicle-to-grid communication; neither alone proves certification for every market. In Australia, check electrical-installation obligations and local rules for the exact configuration. See how a 350 kW Быстрая зарядка постоянным током manages power delivery when aligning equipment with site engineering.
What should be checked before adding more chargers?
Rank current locations by contribution margin, uptime and peak-demand exposure—not utilisation alone.
Survey customers and review aborted sessions to separate weak demand from access, payment or reliability friction.
Request a connection and tariff assessment before selecting power level or connector count.
Specify reporting fields, remote support and acceptance tests in the supply agreement.
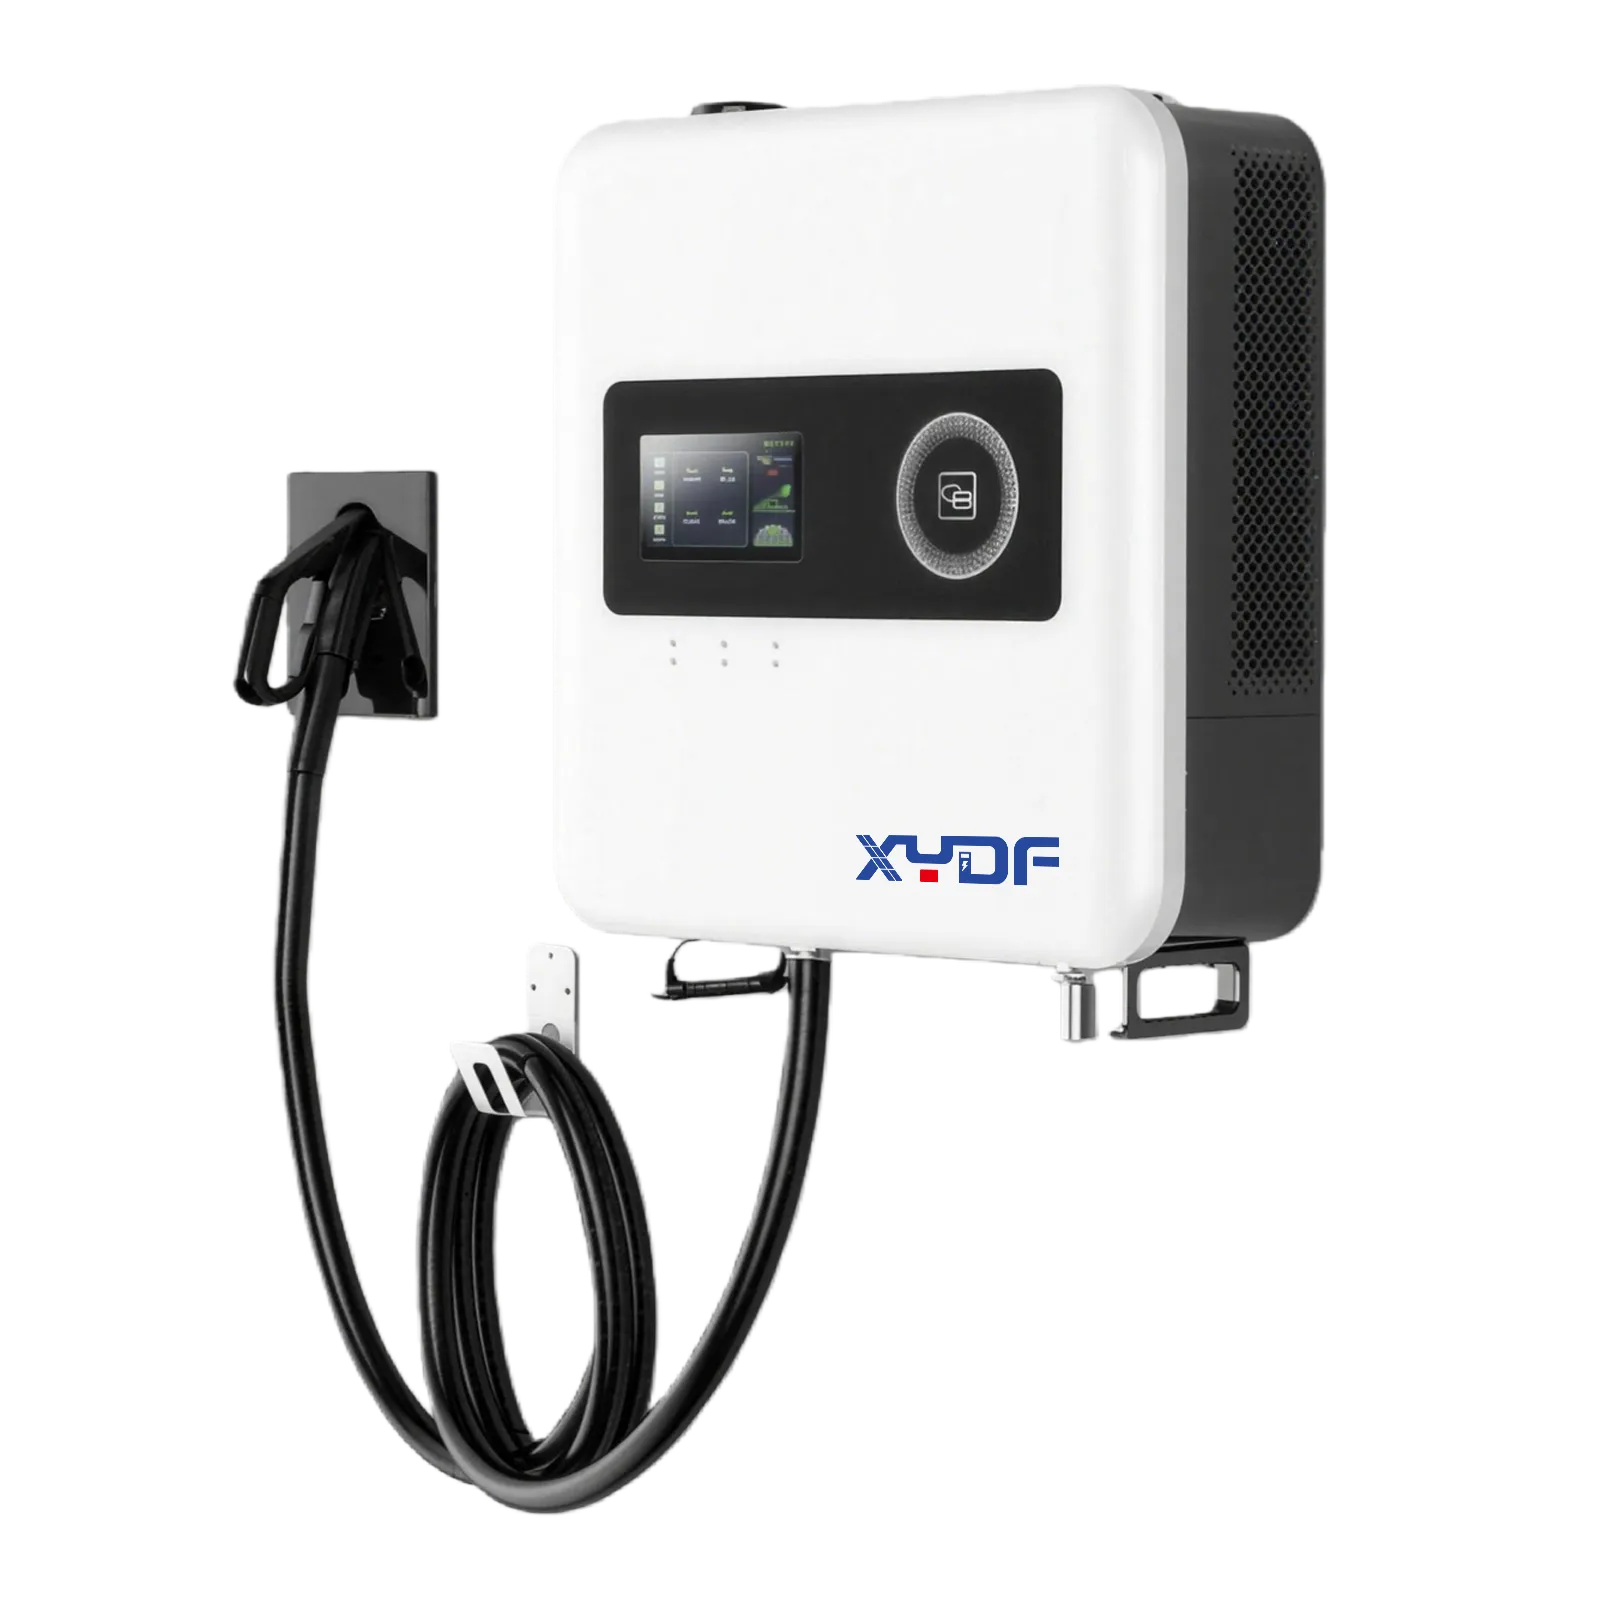
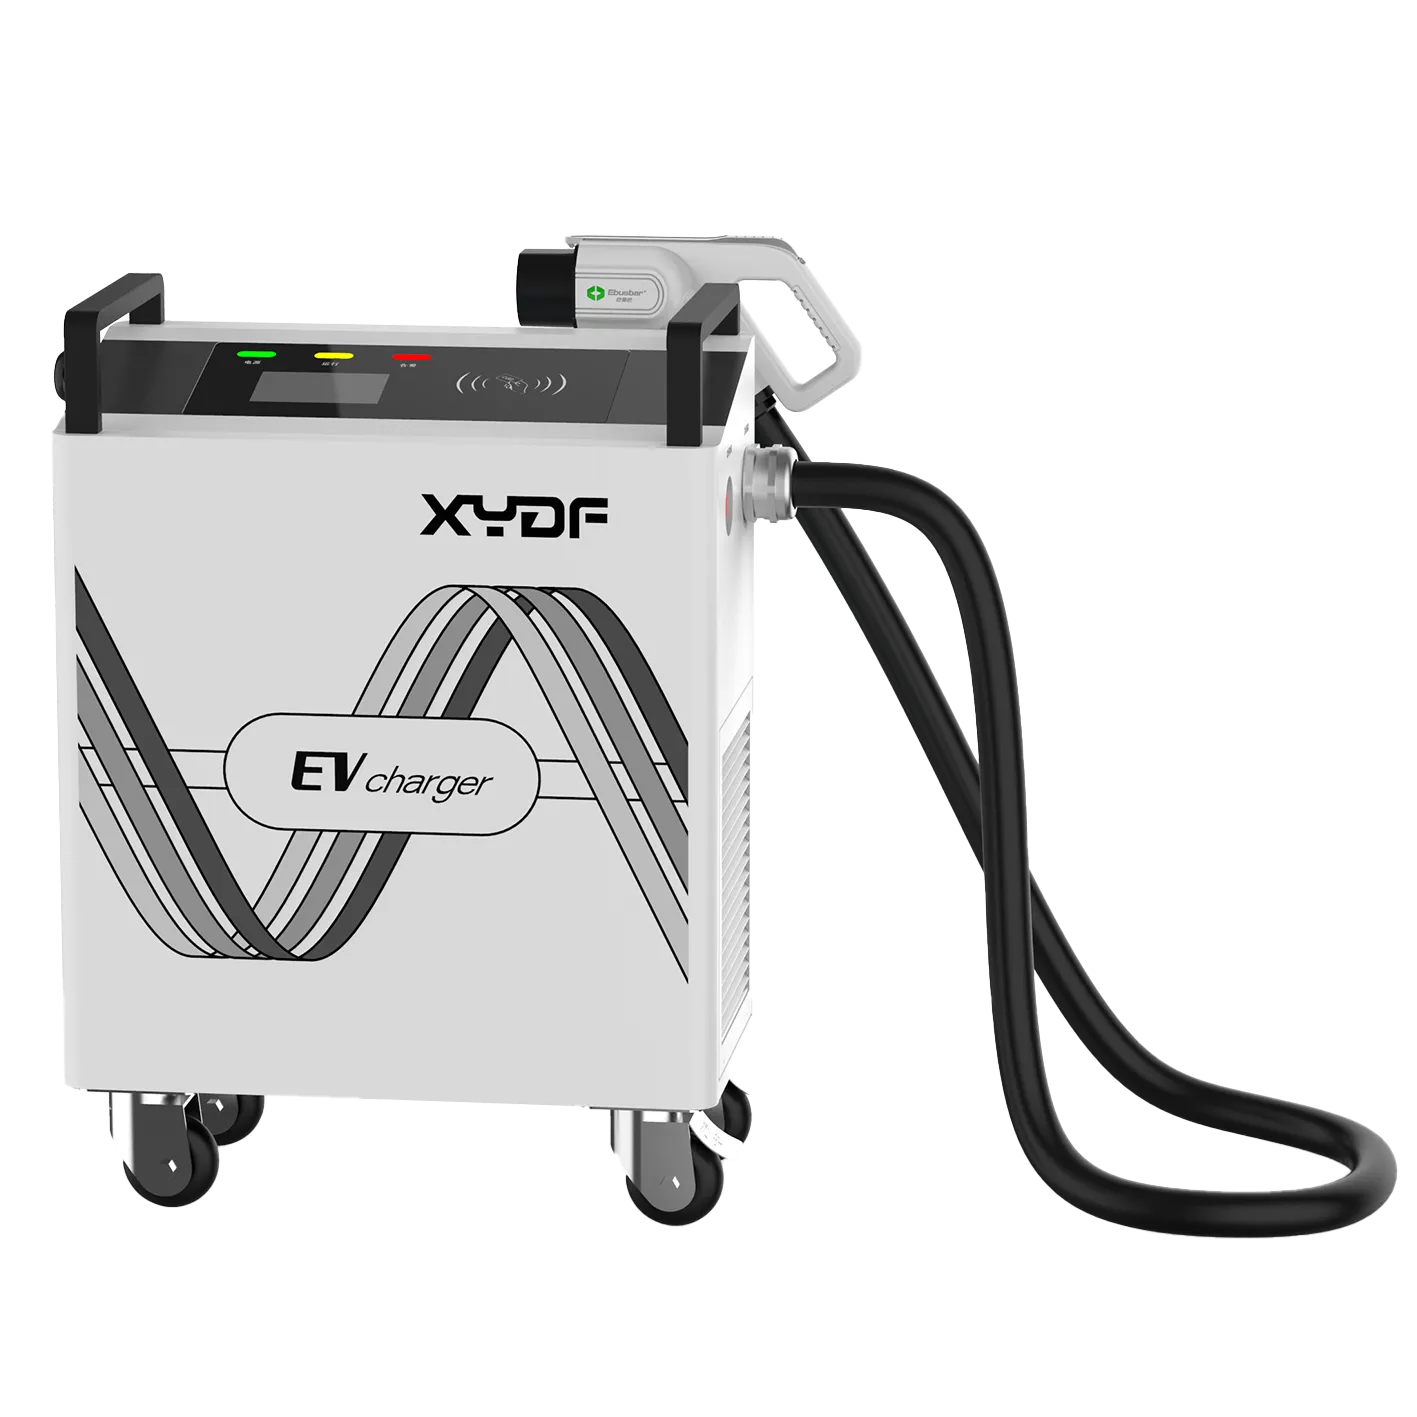
XYDF can support CPOs, fleets, EPCs and distributors evaluating configurable charging equipment and project documentation. Buyers who plan to buy EV charging station equipment should compare the site load profile, operating workflow and support requirements before choosing a configuration.
Questions operators ask about charging-station utilisation
Is it good to start an EV charging station business?
It can be, when the site solves a clear charging need and the revenue model covers energy, fixed costs and service obligations. Start with a pilot or staged rollout where utilisation, grid capacity and host economics are still uncertain.
Can I make money from an EV charging station?
Yes, but revenue alone is not profit. Test contribution margin after electricity, demand charges, payment fees, site payments, software and maintenance; then calculate the sessions and kWh needed to cover fixed costs.
Как начать бизнес по установке зарядных станций для электромобилей?
Choose a customer segment and site type, obtain a grid and tariff assessment, define the operating and payment model, then procure equipment with measurable service requirements. For a new electric car charging station business, document who manages faults, billing and support before launch.
Каково правило 80/20 для зарядки электромобилей?
The phrase commonly refers to charging an EV battery to around 80% rather than 100% when time, battery care or charging-curve efficiency matters. It is not a universal business rule; a car charging station business should base pricing and bay-management policies on its customers’ dwell time and turnover needs.
A charging-station business case becomes clearer when utilisation is separated into time, energy, availability, completed sessions, and margin. Use connector-level and 15-minute data to show when demand occurs, then test dwell time, tariff, demand charges, payment fees, maintenance, site costs, and capital recovery in base, downside, and ramp-up cases. A low percentage may reflect the intended long-dwell use; a high percentage may hide idle occupancy, faults, or an expensive peak. Before adding ports, confirm whether the constraint is demand, access, pricing, reliability, or grid capacity. For the next site or expansion, compare the Линейка зарядного оборудования XYDF with the measured operating model rather than connector count alone.
Штаб-квартира и фабрика в Чжэцзяне:
№ 2, улица Чанцзян, промышленный парк Вэньчжоу Бридж, город Бейбайсян, город Юэцин, город Вэньчжоу, провинция Чжэцзян
Шэньчжэньский филиал:
1-й этаж, здание А, промышленный парк Шэнькай, сообщество Тантоу, район Шиянь, район Баоань, Шэньчжэнь
Мы используем файлы cookie для обеспечения работы этого веб-сайта и, с вашего разрешения, для измерения того, как посетители используют наш сайт зарядки электромобилей. См. наши Политика конфиденциальности для получения подробной информации.
 Синьцзя Дунфан Электрик Технолоджи Ко., Лтд.