How Should Project Teams Profile Electrical Load Before Selecting Commercial EV Chargers?
Jul 16,2026
Blog
Before selecting charger quantity and power level for commercial ev charging, project teams should build a load profile from dwell time, vehicle mix, arrival patterns, and simultaneous charging probability — then translate that curve into AC/DC architecture and grid capacity.
Part 1. What is load profiling in a commercial EV charging project?
Para una decisión comercial de carga defensiva, se debe separar la cuestión del consumo de energía de la capacidad de servicio utilizable. Registre los ciclos de uso del vehículo, las ventanas de entrada y salida, las sesiones simultáneas, los límites de demanda del emplazamiento y los requisitos de la empresa de servicios públicos antes de comparar los modelos de cargador. La orientación normativa pública puede definir las variables, pero la afirmación final de capacidad debe ser verificada con los propios datos de intervalo del emplazamiento. Para el contexto de planificación pública, véase NREL gestiona la orientación sobre la carga de vehículos eléctricos; El registro de aceptación específico del sitio sigue siendo el factor determinante de la decisión final.
Load profiling estimates how much charging power a site needs, when it needs it, and how concentrated demand becomes across the day. It connects parking behavior to transformer sizing, feeder design, charger count, and operating cost.
Without a profile, teams often oversize DC power for long-dwell workplaces or undercount simultaneous demand at fleet depots.
Profile output
Used by
Typical mistake
Hourly demand curve
Electrical engineer
Using one peak-nameplate number all day
Simultaneous kW
Transformer and feeder sizing
Assuming 100% nameplate on every port
Session count
Charger quantity
Counting parking spaces as charging ports
Exposición a los aranceles
Operator finance
Ignoring demand charge windows
A technically oversized design can still fail commercially if utilization and tariff exposure are not modeled together.
Una defensable Perfilación de la carga de carga eléctrica para vehículos comerciales decision joins arrival timing, energy per session, coincidence, tariff interval and staged capacity; it does not convert the sum of charger nameplates directly into a transformer order. IEC 61851-1 defines the conductive charging-system requirements, while the utility tariff and interconnection study determine the commercial and electrical limits for a specific site.
Part 2. Which inputs must be collected before any power calculation?
Accurate profiling starts with use-case definition, not catalog pages.
Bloque de entrada
Ejemplos
Why it changes results
Grupo de usuarios
Employees, visitors, fleet, public access
Dwell time and arrival curve
Parking duration
8 h workplace, 45 min retail, 10 h depot
AC vs DC suitability
Múltiples vehículos
Battery size, onboard AC kW, DC peak acceptance
Per-port power requirement
Arrival state-of-charge
40% fleet return, 70% visitor parking
Energy needed per session
Operating hours
Weekday only vs 24/7 public
Peak window width
Horizontes de crecimiento
2-year EV share target
Staged expansion allowance
Facility teams often say they “do not know how many cars will charge at once.” Start with conservative simultaneous factors and refine after 60-90 days of session data. (fleet charging project factors)
Six checks before an RFQ is sized
Set the service boundary. Record the utility service voltage, contracted capacity, billing demand interval and any export or power-factor rules. The U.S. Department of Energy’s Alternative Fuels Data Center laws and incentives database is a starting point for local rules, but the serving utility tariff controls the final answer.
Segment arrivals. Separate employees, visitors, taxis and fleet vehicles; assign an arrival window, dwell-time distribution and departure deadline to each group instead of using one daily average.
Convert trips to energy. Use measured or documented energy required per session, then state the assumed charging loss. Keep battery energy, delivered energy and grid energy as separate columns.
Calculate coincidence by interval. For every billing interval, count vehicles actively drawing power; test a synchronized-return case for fleets and a bursty short-dwell case for retail.
Overlay controls and tariffs. Compare uncontrolled load with a site kW cap, queue rule and departure-priority rule. A control plan is only valid if the charger, backend and meter expose compatible limits; OCPP documentation from the Open Charge Alliance describes protocol capabilities, not a guarantee that every device implements every profile.
Stage the commitment. Specify which conduits, switchgear space and transformer capacity are installed now, which ports are activated later, and what measured trigger unlocks phase two.
Export the site interval data, arrival and departure windows, coincident-load assumption, transformer headroom and tariff demand interval as one reviewed profile before the charger power is frozen.
Part 3. How do you build a time-based charging demand curve?
Map expected sessions to clock time for a representative weekday and, if needed, a weekend day.
Paso
Acción
Salida
1
Estimate daily EV sessions by user group
Session count
2
Assign typical plug-in time windows
Hourly arrival histogram
3
Convert sessions to energy demand
kWh per interval
4
Convert energy to charging power
kW demand by hour
5
Overlay tariff periods
Cost-sensitive windows
Example pattern for a workplace site:
Time window
Dominant behavior
Design note
07:00-09:00
Arrival surge
Many short handshake events, moderate power
09:00-16:00
Long dwell AC charging
Lower power per port, longer sessions
16:00-18:00
Departure prep
Smart charging may shift peaks
Weekend
Lower occupancy
Different utilization target
Part 4. How should simultaneous load and diversity be estimated?
Not every connected vehicle draws nameplate power at the same time. Diversity factors help — but fleet depots usually need more conservative assumptions than workplace parking.
Tipo de sitio
Tendencia a cargar simultáneamente
Postura adecuada para el tamaño
Workplace employee parking
Medium diversity
Load management adds headroom
Retail / hospitality
Short sessions, bursty peaks
Fewer ports but higher turnover planning
Depósito de flota
High simultaneity at return window
Factor de diversidad conservador
Plaza pública de DC
High power, shorter queue tolerance
Queue design + power sharing rules
Method
Formula concept
Use when
Estante de placas de identificación
Sum all port kW
Only for worst-case utility review
Diversity-adjusted
Apply factor by use case
Most commercial designs
Managed cap
Set site kW ceiling in software
Grid limit is binding
Document the diversity factor assumption in the RFQ. Suppliers can only recommend load management and power sharing if the target site cap is explicit. (OCPP EV charger guide)
Illustrative calculation (assumptions shown, not site data)
Assume 20 workplace vehicles each need 18 kWh during an 8-hour dwell, with 90% wall-to-battery efficiency. Grid energy is 20 × 18 ÷ 0.90 = 400 kWh; spread across eight hours, the average charging demand is 400 ÷ 8 = 50 kW. Twelve 7.4 kW AC ports have 88.8 kW of installed nameplate, but a managed 0.56 coincidence factor would cap the modeled peak at about 88.8 × 0.56 = 49.7 kW. This is an illustration only: replace every assumption with interval data, vehicle acceptance limits and the utility’s billing interval before approving equipment.
The calculation also exposes a boundary: if all 20 vehicles return in a 30-minute window, the 50 kW average is no longer a safe proxy for instantaneous demand. The project team should run a synchronized-return scenario, apply the site’s power cap, and ask the electrical engineer to verify transformer, feeder, protection and thermal derating constraints.
Part 5. When should a site use AC, DC, or a mixed architecture?
The load profile should drive technology choice — not the reverse.
Caso de uso
Typical dwell
Starting architecture
Workplace / office
4-10 hours
AC-heavy with smart scheduling
Retail / hotel
1-3 hours
AC mixto más DC selectivo
Highway / quick-turn public
<45 minutes
DC-first
Depósito de flota
Fixed return window
DC with managed simultaneity
Decision trigger
Lean AC
Add DC
Median dwell > 3 h
Yes
Only for VIP or public wing
Median dwell < 1 h
No
Yes
Battery state-of-charge often low at arrival
Maybe
More likely
Grid capacity constrained
AC plus dynamic load management
High-power DC requires cap control
For technology fundamentals without repeating a full AC vs DC article, route readers to existing site content and keep this page focused on demand modeling.
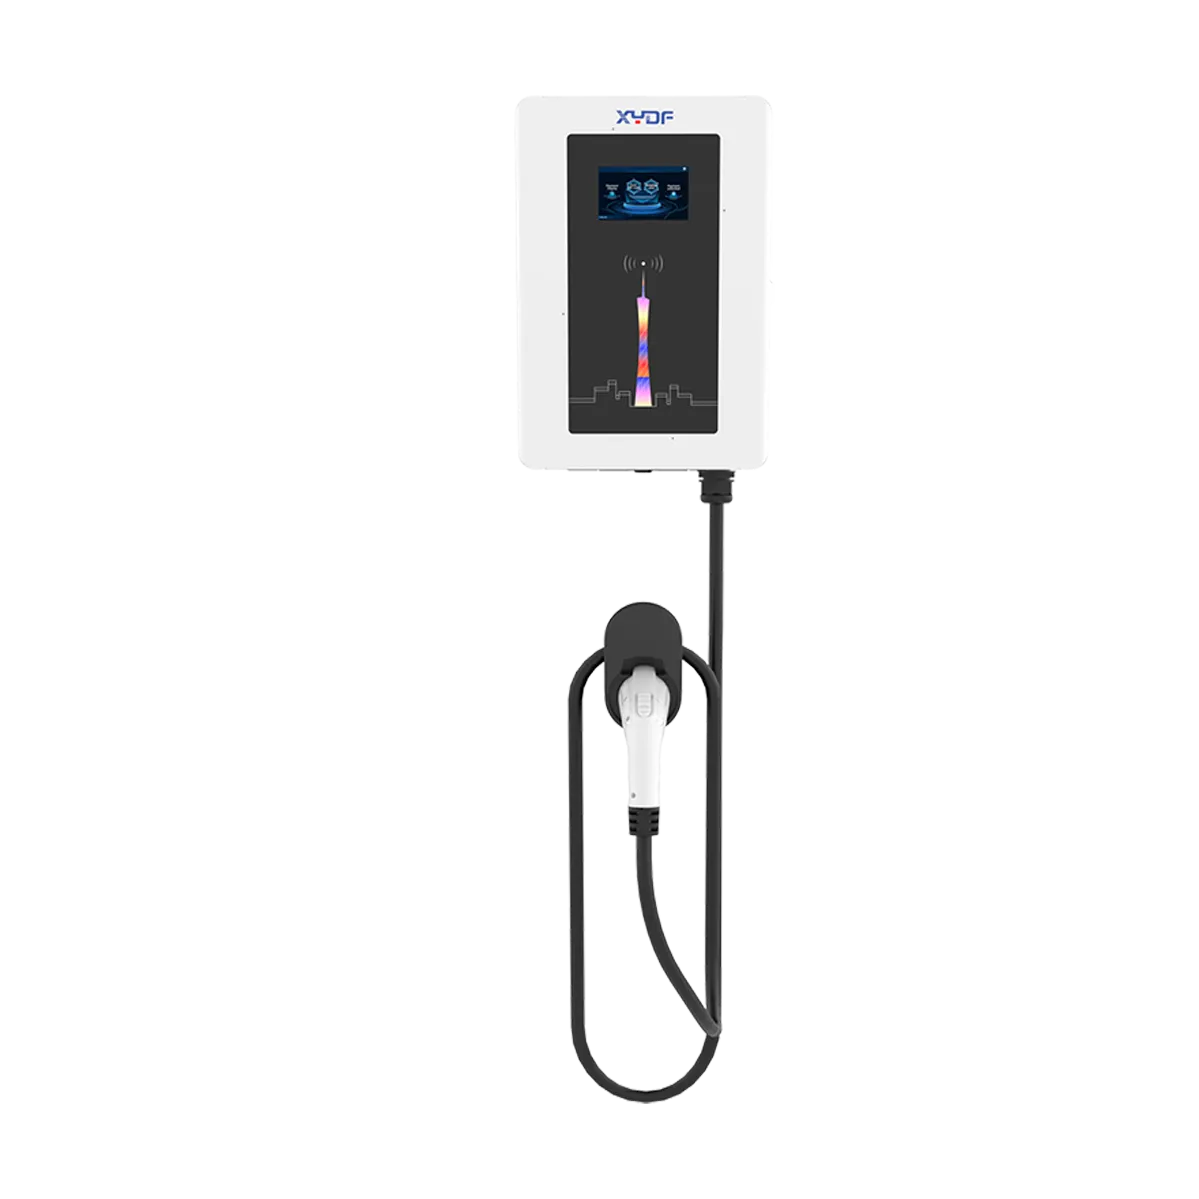
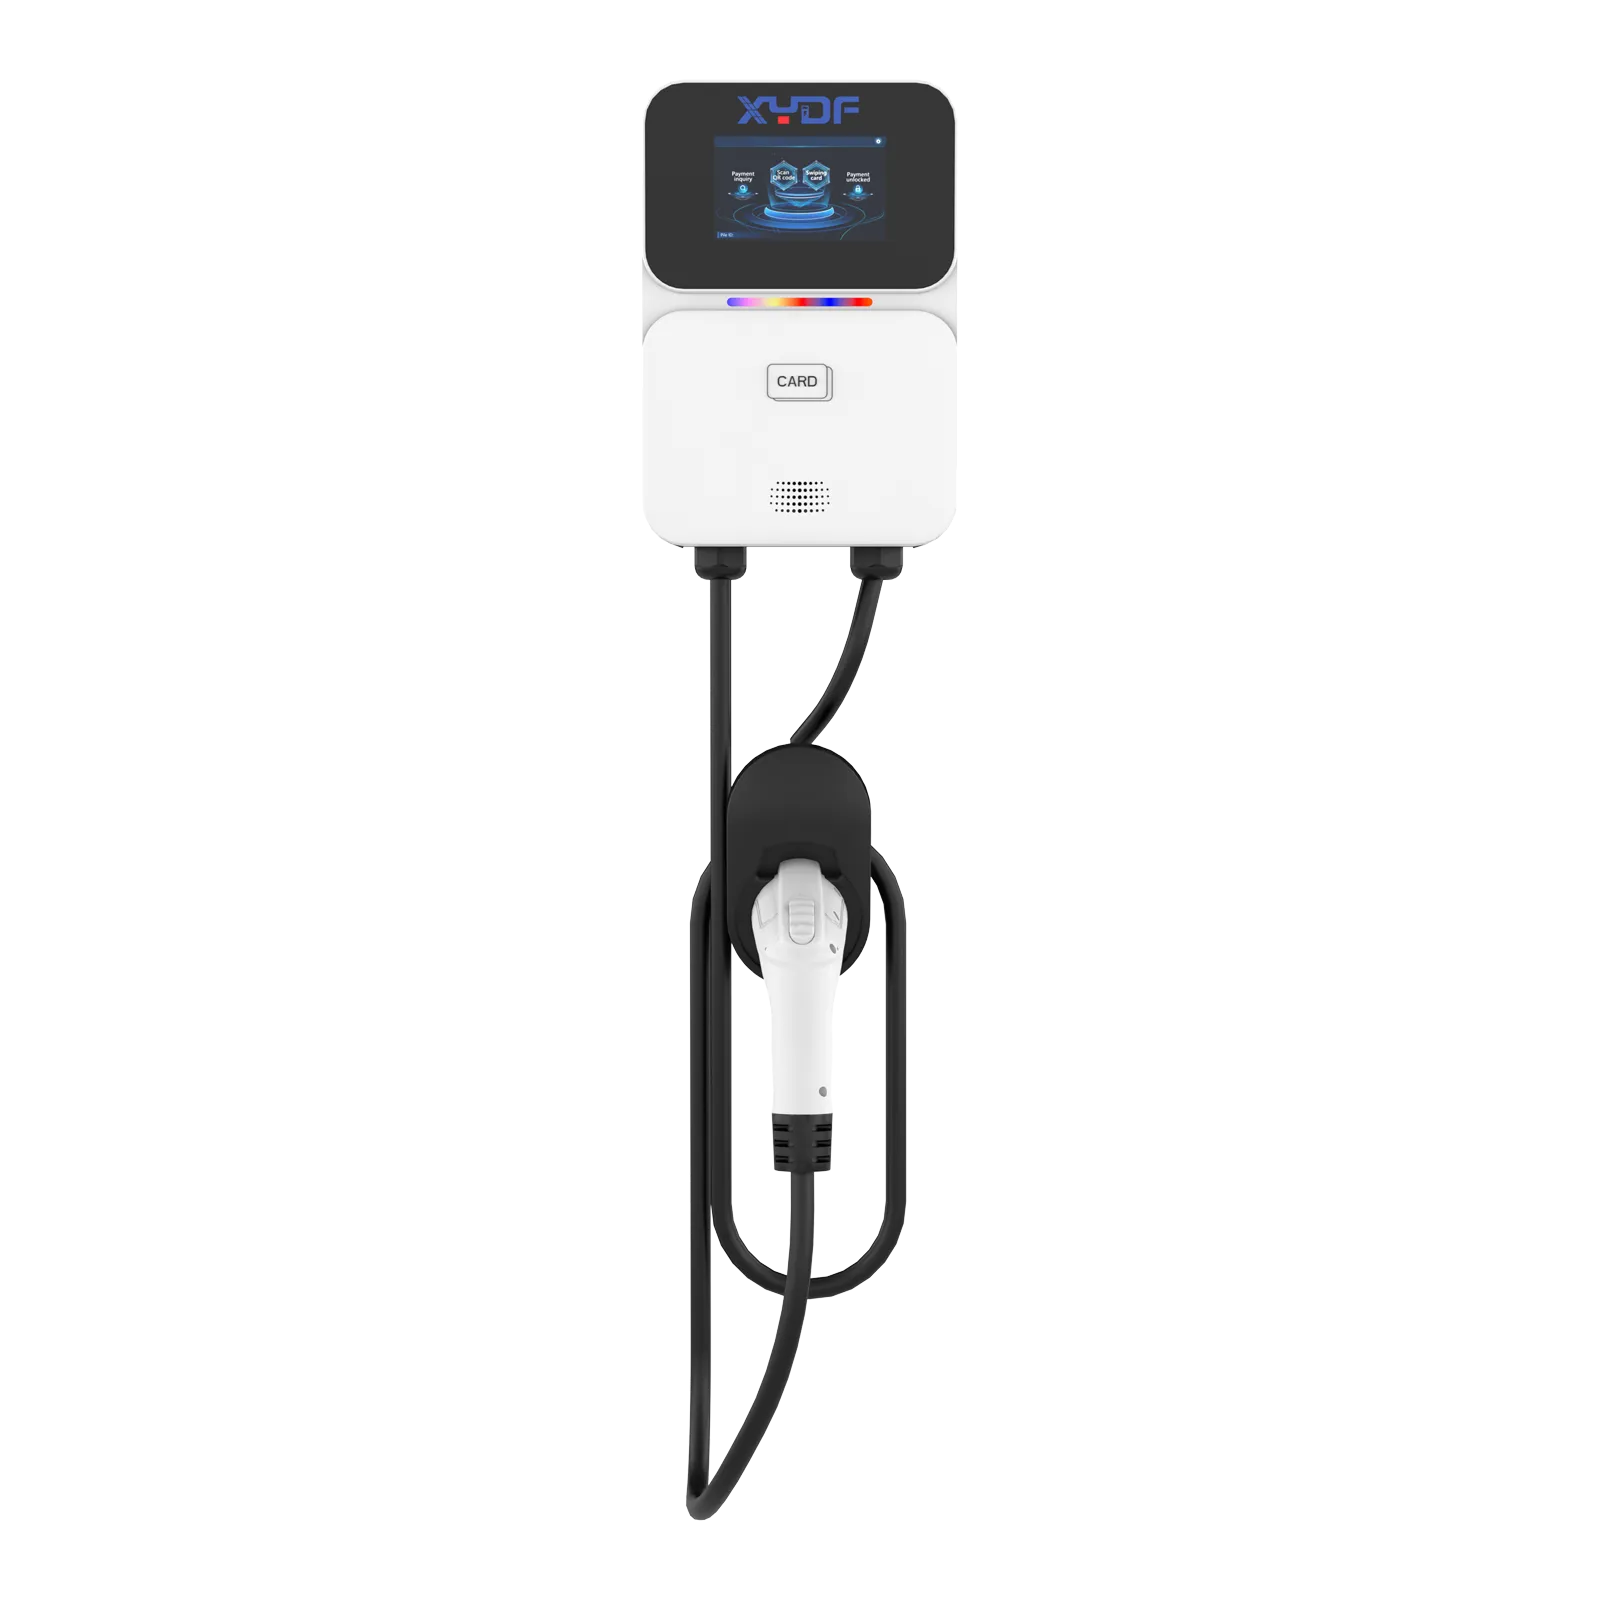
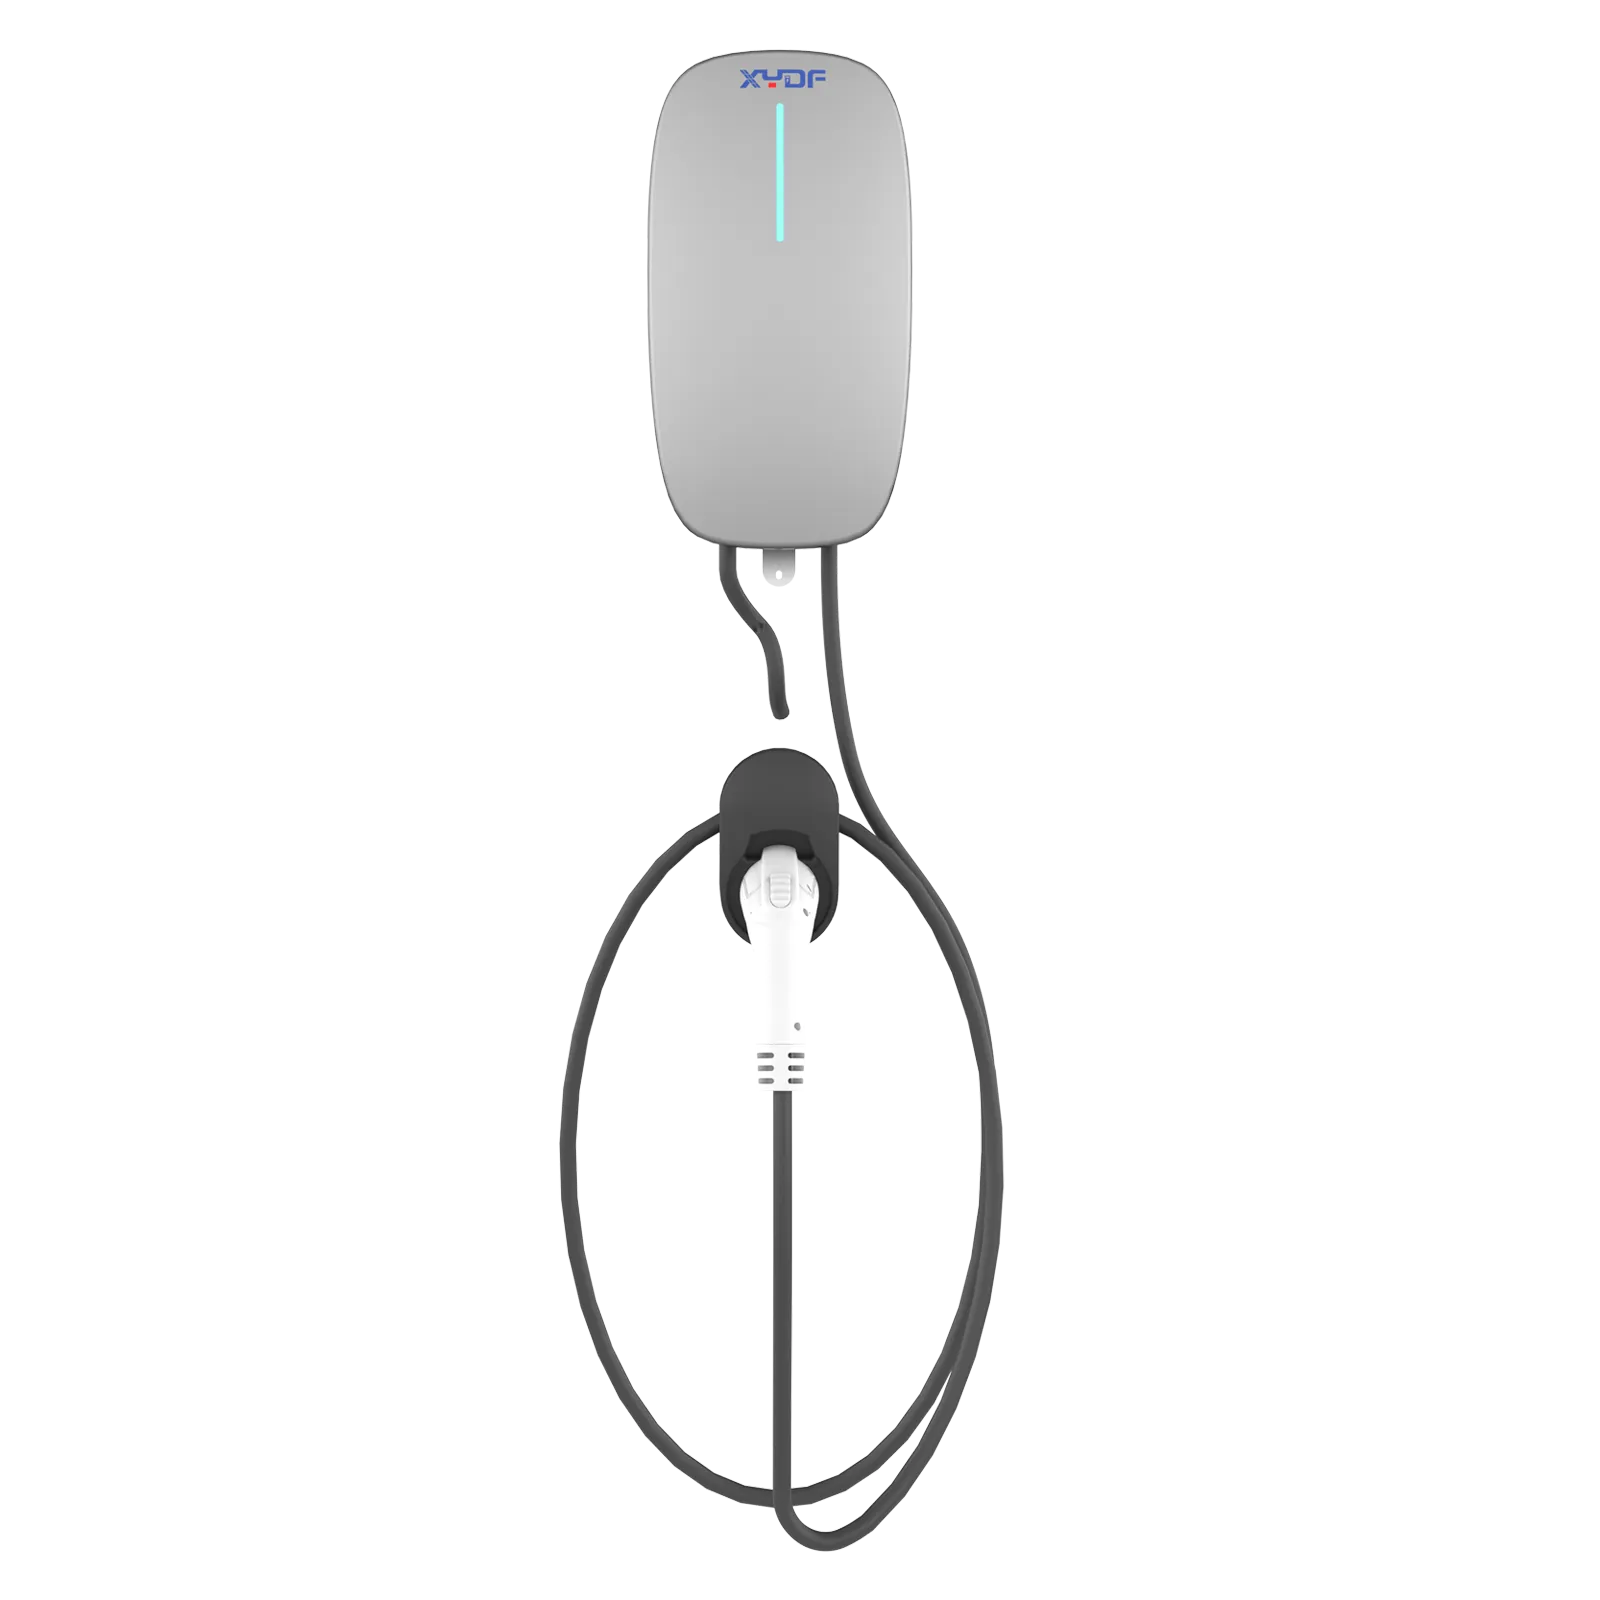
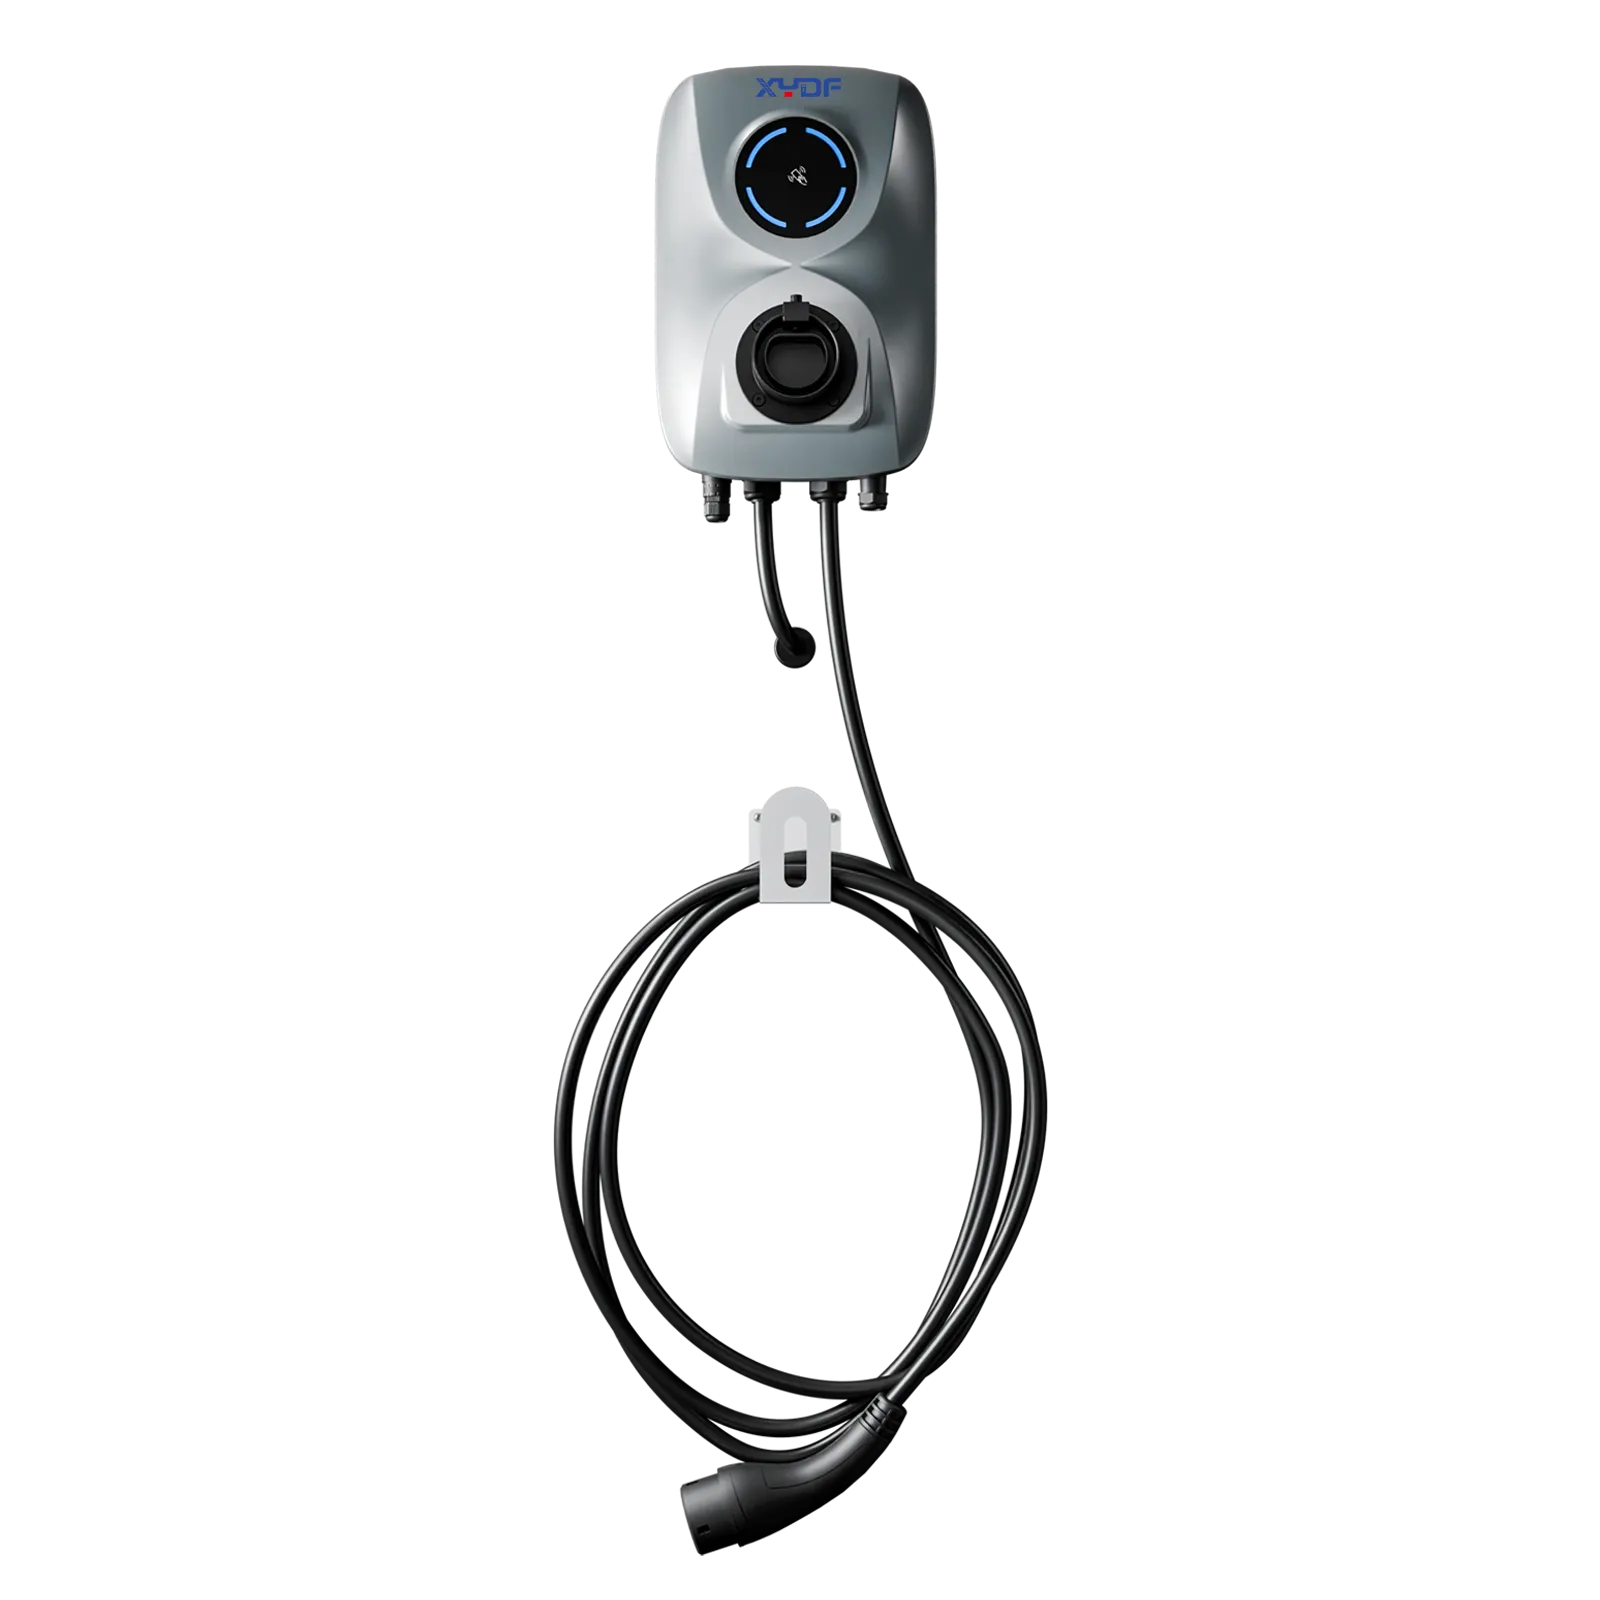
Part 6. Which XYDF platforms match common commercial load outcomes?
Part 7. When Should Measured Site Data, Utility Input, or Engineering Review Override the Initial Profile?
This guide supports commercial charger selection and electrical planning inputs. It does not replace:
Estudios de interconexión de redes de servicios públicos o revisiones formales de impacto en la red eléctrica
Cable sizing, protection coordination, or construction drawings
Certificación de la red de pagos o negociaciones tarifarias
Ingeniería del tráfico o diseño de la circulación de estacionamiento
Modelado energético de rutas de flota para ciclos de trabajo pesados
If arrival data, vehicle mix, or simultaneity assumptions are unknown, publish a staged design with monitoring points rather than locking maximum power on day one.
Which Site Findings Require the Load Model to Be Recalculated?
Condition
What to change in the model
Decision boundary
Fleet return times are synchronized
Use short intervals and a high-coincidence case
Do not rely on workplace diversity factors
Dwell time is below one hour
Test DC power, queue delay and connector turnover
Energy-per-session, not port count, sets adequacy
Utility capacity is binding
Model a hard site cap, load shedding and phase two
Obtain interconnection approval before procurement
Outdoor or hot-climate installation
Use manufacturer derating and thermal study inputs
Nameplate power is not guaranteed continuous output
Standards: scope before marketing language
Usos IEC 61851-1 for general conductive charging-system requirements and IEC 61851-23 for DC charging-system requirements. ISO 15118 addresses vehicle-to-grid communication; it is not a substitute for electrical installation approval. OCPP is an application protocol, not a safety certification. Product claims should name the market, edition and test scope; “supports OCPP” or “IEC compliant” without a documented scope can create tender, warranty and enforcement risk.
Preguntas frecuentes
What is commercial EV charging load profiling?
It is the process of estimating when charging demand occurs, how many sessions overlap, and how much power the site must deliver across the day.
What data should be collected first?
Define user group, dwell time, vehicle mix, arrival state-of-charge, operating hours, and a realistic EV adoption horizon before calculating kW.
How is simultaneous load different from total installed power?
Installed power is the sum of charger nameplates. Simultaneous load is the power actually drawn at the same time — usually lower except in fleet depots.
Should workplaces default to AC chargers?
Long-dwell workplaces often start AC-heavy because vehicles remain parked long enough to deliver useful energy at lower per-port power.
How do demand charges affect charger design?
If tariffs apply demand charges to peak demand, the profile should identify whether software load management can cap site kW without harming user experience.
When is staged deployment better than full build-out?
When adoption forecasts are uncertain or grid capacity is limited. Stage ports, monitoring, and feeder capacity for a second phase.
What should be sent to an EV charger manufacturer?
Send the demand curve, diversity assumptions, target connector standards, OCPP/backend requirements, and site kW cap so the supplier can propose AC/DC mix and load management.
What interval should a commercial charging load profile use?
Use the utility’s actual billing-demand interval for cost exposure, then retain finer telemetry for control and queue analysis. If the tariff is unknown, run both a 15-minute planning case and a finer operational case, and label the assumption for the utility to confirm.
How much transformer headroom is enough?
There is no universal percentage. Headroom depends on existing non-EV load, ambient conditions, protection settings, harmonics and the utility’s study; the electrical engineer should document the governing limit rather than copy a generic reserve factor.
Can software load management replace a grid upgrade?
It can reduce coincident demand when vehicles have flexible departure times, but it cannot create energy or remove a sustained capacity deficit. Validate meter response, fail-safe behavior and user-priority rules before treating a software cap as an interconnection solution.
Which commissioning metrics should be checked first?
Track interval peak kW, coincidence, kWh per session, plug-in-to-start delay and sessions missing their departure target for at least one representative operating cycle. Use those observations to release staged capacity, not to retroactively justify an unsupported design assumption.
For a documented equipment shortlist, compare the Gamma de cargadores AC con el Gamma de cargadores rápidos DC only after the profile and site cap are agreed; the broader Catálogo de productos can then be matched to the approved duty cycle. The honest commercial EV charging load profiling rule is simple: measure the constraint, state the assumption, and stage the irreversible spend.
\n
A second commercial EV charging load profiling pass should test the utility billing interval against a synchronized fleet-return case before equipment quantities are frozen.
\n
When tariff data is incomplete, mark the commercial EV charging load profiling result as provisional and schedule a meter-data refresh before phase-two capacity is released.
\n
¿Qué datos debería incluir un modelo de capacidad de carga comercial para vehículos eléctricos?
Un modelo de capacidad útil combina la energía del vehículo según el ciclo de carga, las ventanas de entrada y salida, la carga simultánea, el comportamiento de distribución de la potencia del cargador, los límites eléctricos del emplazamiento, los intervalos tarifarios y una reserva para sesiones tardías o no realizadas. El modelo debería mostrar las suposiciones y el punto de medición de aceptación para que los compradores puedan comparar las propuestas sin considerar un valor kW en la placa de identificación como capacidad de servicio garantizada.
Fábrica de la sede en Zhejiang:
N.º 2, Calle Changjiang, Parque Industrial del Puente de Wenzhou, Ciudad de Beibaixiang, Ciudad de Yueqing, Ciudad de Wenzhou, Provincia de Zhejiang
Sucursal de Shenzhen:
1.er piso, Edificio A, Parque Industrial Shenkai, Comunidad Tangtou, Subdistrito Shiyan, Distrito de Bao'an, Shenzhen
Utilizamos cookies para que este sitio web funcione y, con su permiso, para medir cómo los visitantes utilizan nuestro sitio de carga de vehículos eléctricos. Consulte nuestra Política de Privacidad para más detalles.
 Xinya Dongfang Electricity Technology Co., Ltd.