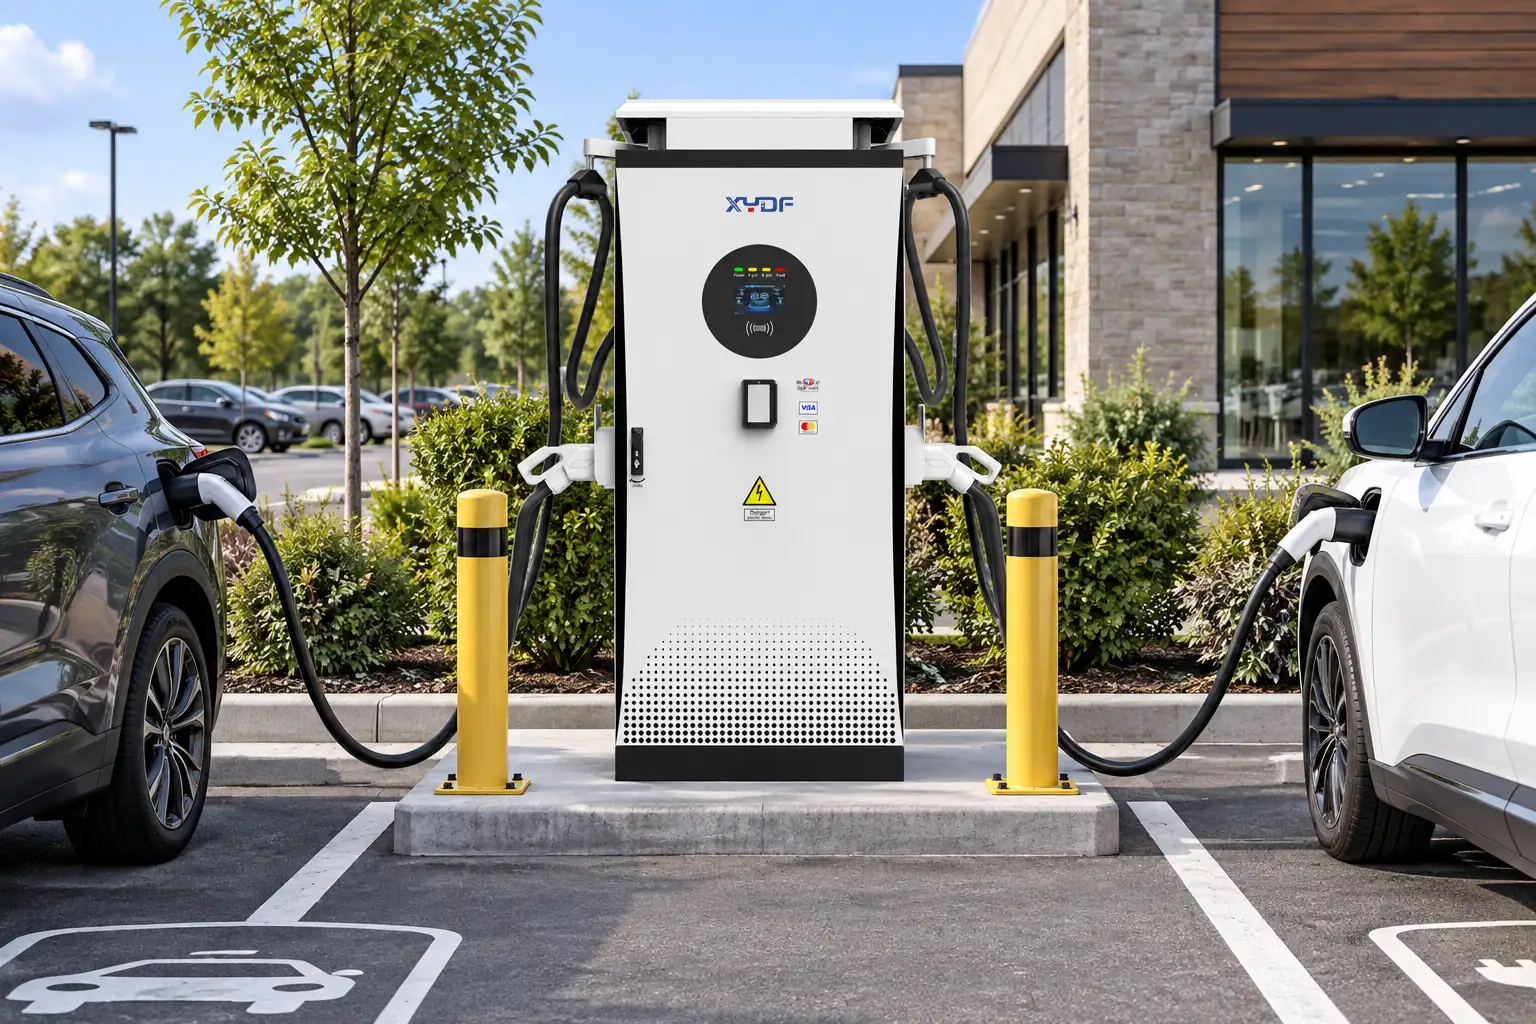
Comment les équipes de projet doivent-elles analyser la charge électrique avant de choisir des bornes de recharge pour véhicules électriques à usage commercial ?
16 juillet 2026
Blog
Avant de sélectionner la quantité de chargeurs et le niveau de puissance pour la recharge de véhicules électriques commerciaux, les équipes de projet doivent construire un profil de charge à partir du temps de séjour, de la combinaison de véhicules, des schémas d'arrivée et de la probabilité de recharge simultanée, puis traduire cette courbe en architecture AC/DC et en capacité du réseau.
Partie 1. Qu'est-ce que le profilage de charge dans un projet de recharge de véhicules électriques commerciaux ?
Pour une décision commerciale de charge justifiable, il faut séparer la question de la puissance de l’équipement de la question de la capacité de service utilisable. Il faut enregistrer les cycles de charge des véhicules, les fenêtres d’arrivée et de départ, les sessions simultanées, les limites de demande du site, les contraintes liées aux services publics et les coûts opérationnels d’une session manquée avant de comparer les modèles de chargeurs. Les directives de planification publique peuvent encadrer les variables, mais la demande de capacité finale doit être testée en fonction des données d’intervalle propres au site. Pour le contexte de la planification publique, voir NREL a élaboré des directives sur la charge des véhicules électriques; Le dossier d’acceptation site-spécifique reste le facteur déterminant de la décision finale.
Le profilage de charge estime la puissance de recharge dont un site a besoin, quand elle est nécessaire et à quel point la demande se concentre au cours de la journée. Il met en relation le comportement de stationnement avec la taille du transformateur, la conception du réseau, le nombre de chargeurs et le coût d'exploitation.
Sans profil, les équipes surdimensionnent souvent la puissance CC pour les lieux de travail à longue présence ou sous-estiment la demande simultanée dans les dépôts de flotte.
Sortie du profil
Utilisé par
Erreur typique
Courbe de demande horaire
Ingénieur électricien
Utiliser un numéro de plaquette de sommet toute la journée
kW simultanés
Dimensionnement des transformateurs et des feeders
En supposant que chaque port porte la plaque signalétique « 100% »
Nombre de sessions
Quantité de chargement
Compter les places de parking comme bornes de recharge
Exposition tarifaire
Finance opérationnelle
Ignorer les fenêtres de charge de demande
A technically oversized design can still fail commercially if utilization and tariff exposure are not modeled together.
A defensible Profilage de la charge de recharge des véhicules électriques commerciaux decision joins arrival timing, energy per session, coincidence, tariff interval and staged capacity; it does not convert the sum of charger nameplates directly into a transformer order. IEC 61851-1 defines the conductive charging-system requirements, while the utility tariff and interconnection study determine the commercial and electrical limits for a specific site.
Partie 2. Quelles données doivent être collectées avant tout calcul de puissance ?
Le profilage précis commence par la définition du cas d'utilisation, pas par les pages du catalogue.
Bloc d'entrée
Exemples
Pourquoi ça change les résultats
Groupe d'utilisateurs
Employés, visiteurs, flotte, accès public
Temps de séjour et courbe d'arrivée
Durée du stationnement
8 h au travail, 45 min en magasin, 10 h au dépôt
Avantages et inconvénients du courant alternatif et du courant continu
Mélange de véhicules
Taille de la batterie, kW AC embarqués, acceptation crête DC
Besoin d'alimentation par port
Jauge de charge à l'arrivée
40% : parking réservé au personnel, 70% : parking réservé aux visiteurs
Énergie nécessaire par séance
Horaires d'ouverture
En semaine uniquement contre 24h/24, 7j/7 public
Largeur de fenêtre de pointe
Horizon de croissance
objectif de 2 ans pour la part des véhicules électriques
Allocation d'expansion progressive
Les équipes des installations disent souvent qu'elles “ne savent pas combien de voitures vont se recharger en même temps”. Commencez par des facteurs simultanés conservateurs et affinez après 60 à 90 jours de données de session.facteurs du projet de recharge de flotte)
Six checks before an RFQ is sized
Set the service boundary. Record the utility service voltage, contracted capacity, billing demand interval and any export or power-factor rules. The U.S. Department of Energy’s Alternative Fuels Data Center laws and incentives database is a starting point for local rules, but the serving utility tariff controls the final answer.
Segment arrivals. Separate employees, visitors, taxis and fleet vehicles; assign an arrival window, dwell-time distribution and departure deadline to each group instead of using one daily average.
Convert trips to energy. Use measured or documented energy required per session, then state the assumed charging loss. Keep battery energy, delivered energy and grid energy as separate columns.
Calculate coincidence by interval. For every billing interval, count vehicles actively drawing power; test a synchronized-return case for fleets and a bursty short-dwell case for retail.
Overlay controls and tariffs. Compare uncontrolled load with a site kW cap, queue rule and departure-priority rule. A control plan is only valid if the charger, backend and meter expose compatible limits; OCPP documentation from the Alliance de recharge ouverte describes protocol capabilities, not a guarantee that every device implements every profile.
Stage the commitment. Specify which conduits, switchgear space and transformer capacity are installed now, which ports are activated later, and what measured trigger unlocks phase two.
Export the site interval data, arrival and departure windows, coincident-load assumption, transformer headroom and tariff demand interval as one reviewed profile before the charger power is frozen.
Partie 3. Comment construire une courbe de demande de recharge basée sur le temps ?
Cartographier les sessions attendues sur le temps de l'horloge pour une journée représentative de la semaine et, si nécessaire, pour un jour de week-end.
Étape
Action
Sortie
1
Estimer les sessions quotidiennes sur VE par groupe d'utilisateurs
Nombre de sessions
2
Attribuer des fenêtres de temps typiques de branchement
Histogramme des arrivées horaires
3
Convertir les sessions en demande d'énergie
kWh par intervalle
4
Convertir l'énergie en puissance de charge
demande en kW par heure
5
Périodes tarifaires superposées
Fenêtres économes en énergie
Exemple de modèle pour un site de lieu de travail :
fenêtre temporelle
Comportement dominant
Note de conception
07:00-09:00
Afflux/Vague d'arrivées
De nombreux événements de poignée de main courts, puissance modérée
09:00-16:00
Longue charge de courant alternatif
Consommation d'énergie par port plus faible, sessions plus longues
16:00-18:00
Préparation au départ
La recharge intelligente peut déplacer les pics
Week-end
Occupation réduite
Cible d'utilisation différente
Partie 4. Comment estimer la charge et la diversité simultanées ?
Tous les véhicules connectés ne consomment pas la puissance nominale en même temps. Les facteurs de diversité aident - mais les dépôts de flotte nécessitent généralement des hypothèses plus conservatrices que les parkings de bureau.
Type de site
Tendance de charge simultanée
Posture de dimensionnement
Stationnement des employés au travail
Diversité moyenne
La gestion de la charge ajoute de la marge
Vente au détail / hôtellerie
Courtes sessions, pics d'activité intenses
Moins de ports mais une planification de rotation plus élevée
Dépôt de flotte
Haute simultanéité à la fenêtre de retour
Facteur de diversité conservateur
Place publique CC
Haute puissance, tolérance de file d'attente plus courte
Conception de file d'attente + règles de partage de puissance
Méthode
Concept de formule
Utiliser quand
Pile de plaques signalétiques
Additionner tous les kW des ports
Uniquement pour la revue de cas extrêmes d'utilité
Ajusté en fonction de la diversité
Appliquer le facteur par cas d'utilisation
La plupart des modèles commerciaux
Casquette gérée
Définir le plafond des kW du site dans le logiciel
La limite de la grille est contraignante
Document the diversity factor assumption in the RFQ. Suppliers can only recommend load management and power sharing if the target site cap is explicit. (Guide des bornes de recharge pour VE OCPP)
Illustrative calculation (assumptions shown, not site data)
Assume 20 workplace vehicles each need 18 kWh during an 8-hour dwell, with 90% wall-to-battery efficiency. Grid energy is 20 × 18 ÷ 0.90 = 400 kWh; spread across eight hours, the average charging demand is 400 ÷ 8 = 50 kW. Twelve 7.4 kW AC ports have 88.8 kW of installed nameplate, but a managed 0.56 coincidence factor would cap the modeled peak at about 88.8 × 0.56 = 49.7 kW. This is an illustration only: replace every assumption with interval data, vehicle acceptance limits and the utility’s billing interval before approving equipment.
The calculation also exposes a boundary: if all 20 vehicles return in a 30-minute window, the 50 kW average is no longer a safe proxy for instantaneous demand. The project team should run a synchronized-return scenario, apply the site’s power cap, and ask the electrical engineer to verify transformer, feeder, protection and thermal derating constraints.
Partie 5. Quand un site doit-il utiliser une architecture CA, CC ou mixte ?
Le profil de charge devrait guider le choix technologique – et non l'inverse.
Cas d'utilisation
Temps de séjour typique
Architecture de départ
Lieu de travail / bureau
4-10 heures
Climatisation renforcée avec planification intelligente
Détail / hôtel
1-3 heures
AC mixte plus DC sélectif
Autoroute / tournant rapide public
moins de 45 minutes
DC-first
Dépôt de flotte
Fenêtre de retour fixe
CC avec simultanéité gérée
Déclencheur de décision
Maigrir rapidement
Ajouter DC
Médiane durée de résidence > 3 h
Oui
Uniquement pour l'aile VIP ou l'aile publique
Durée de séjour médiane < 1 h
Non
Oui
L'état de charge de la batterie est souvent bas à l'arrivée
Peut-être
Plus probable
Capacité du réseau limitée
Gestion dynamique de la charge AC
La puissance élevée en CC nécessite un contrôle par condensateur
Pour les bases technologiques sans répéter un article complet sur le courant alternatif et le courant continu, redirigez les lecteurs vers le contenu existant du site et concentrez cette page sur la modélisation de la demande.
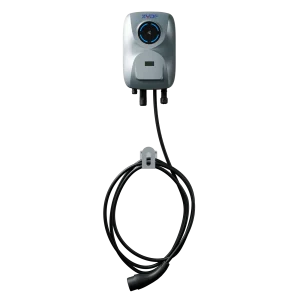
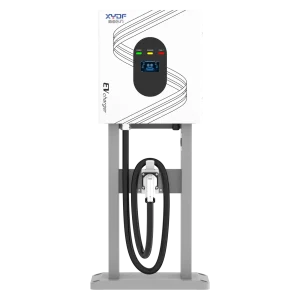
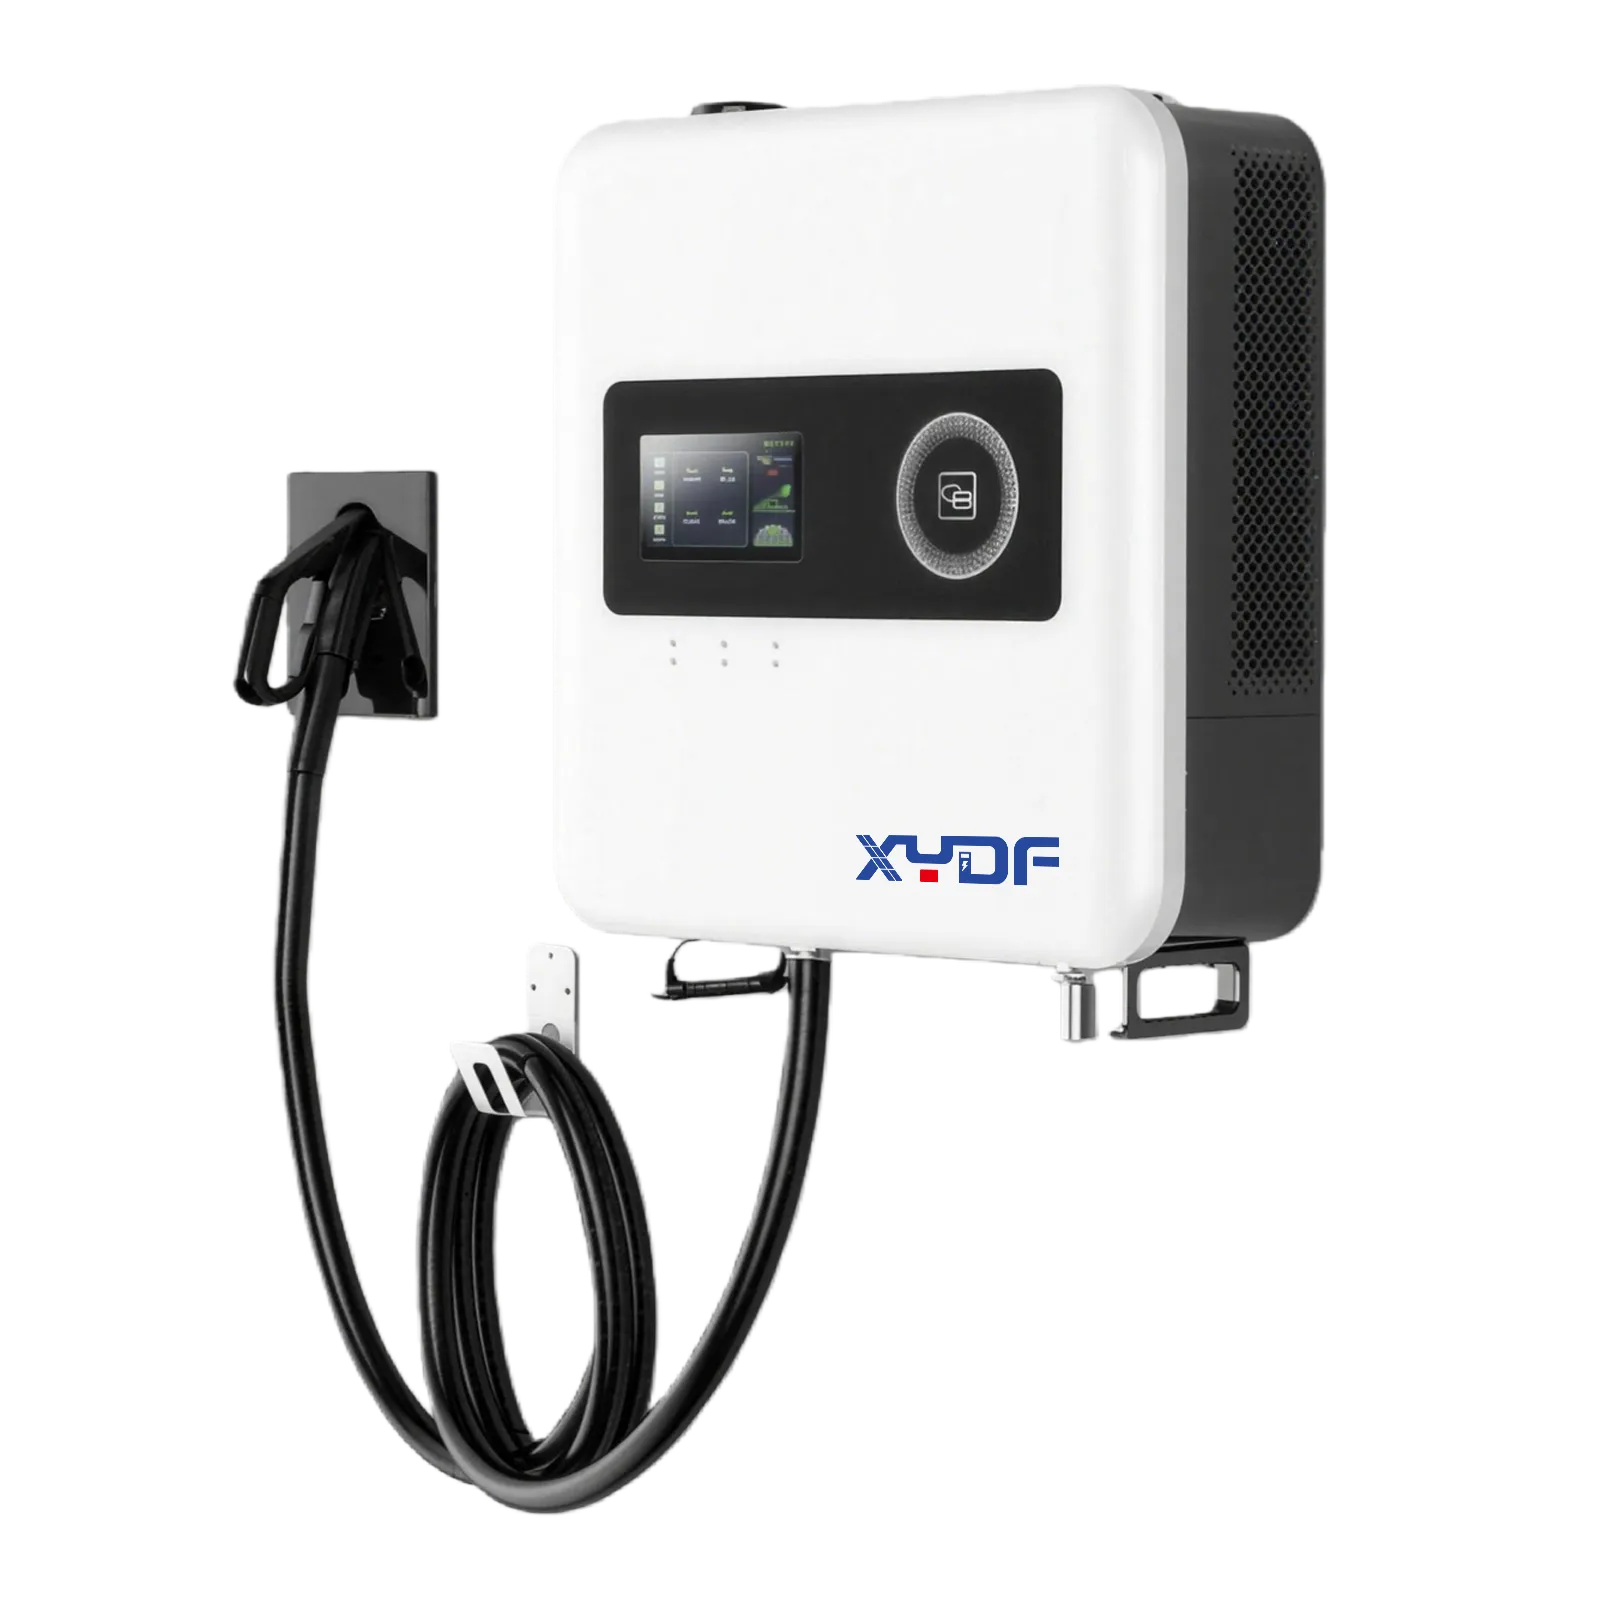
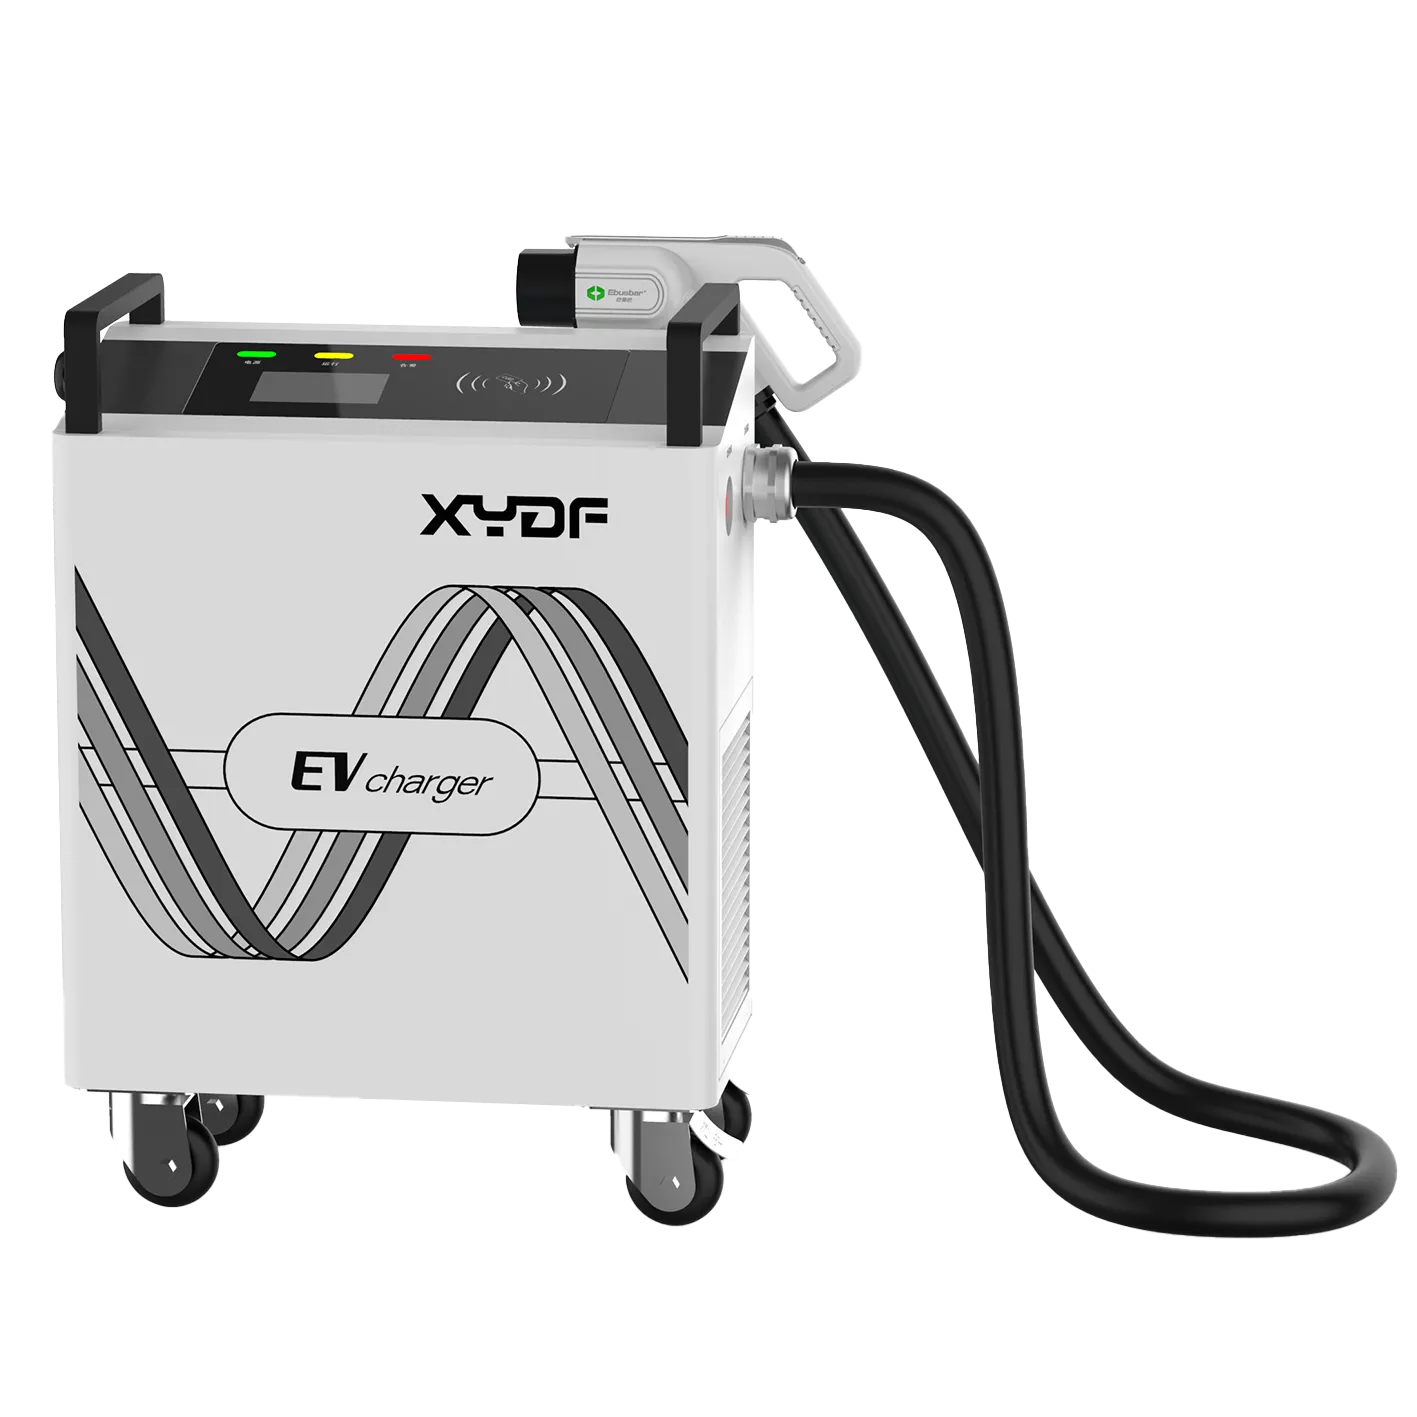
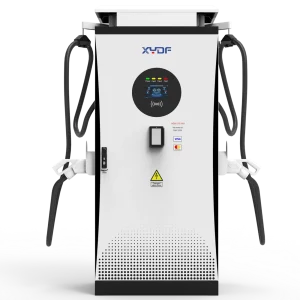
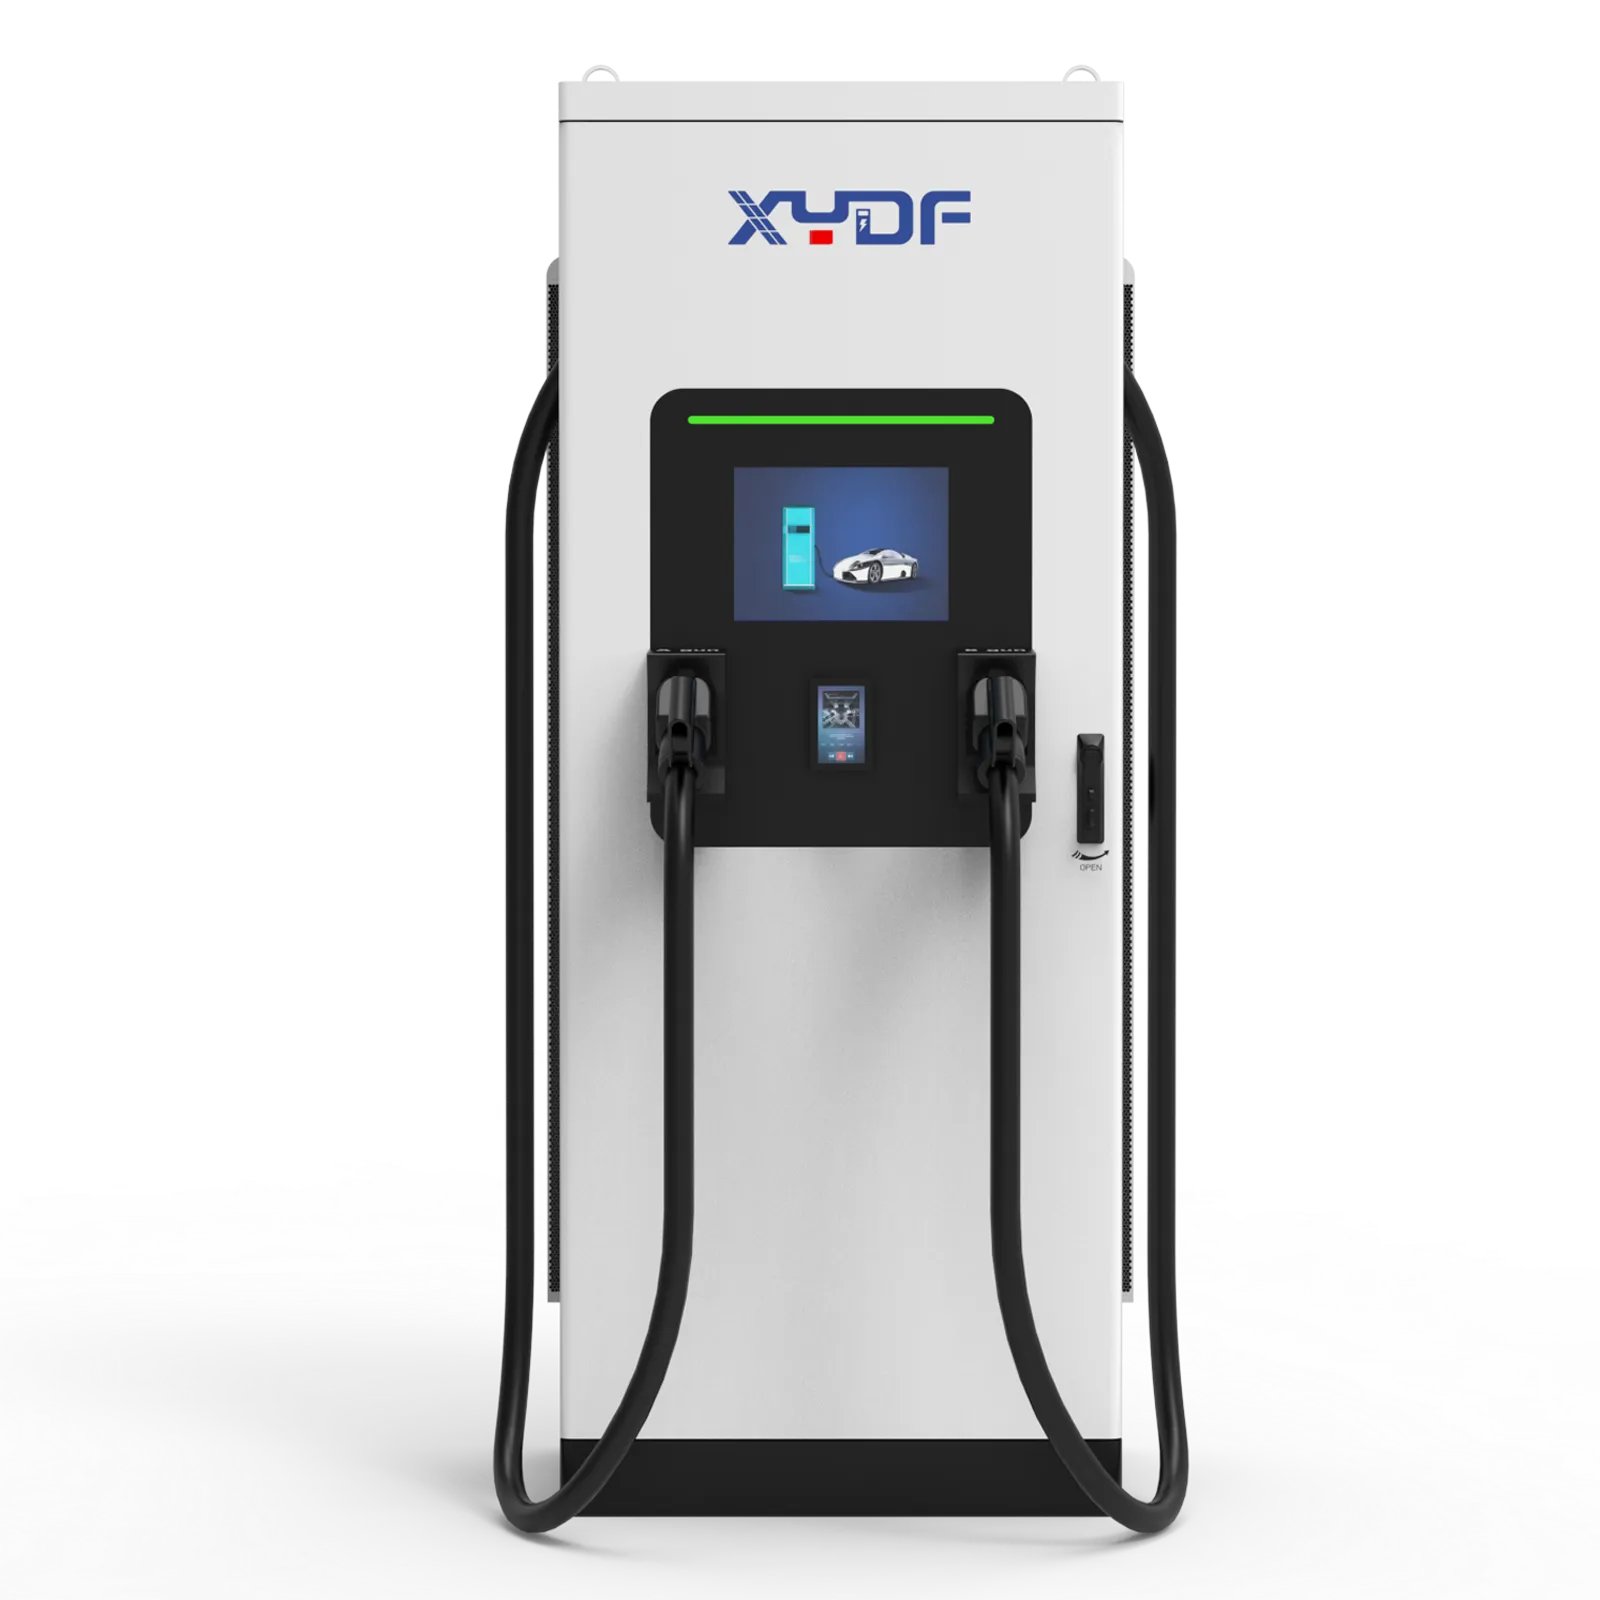
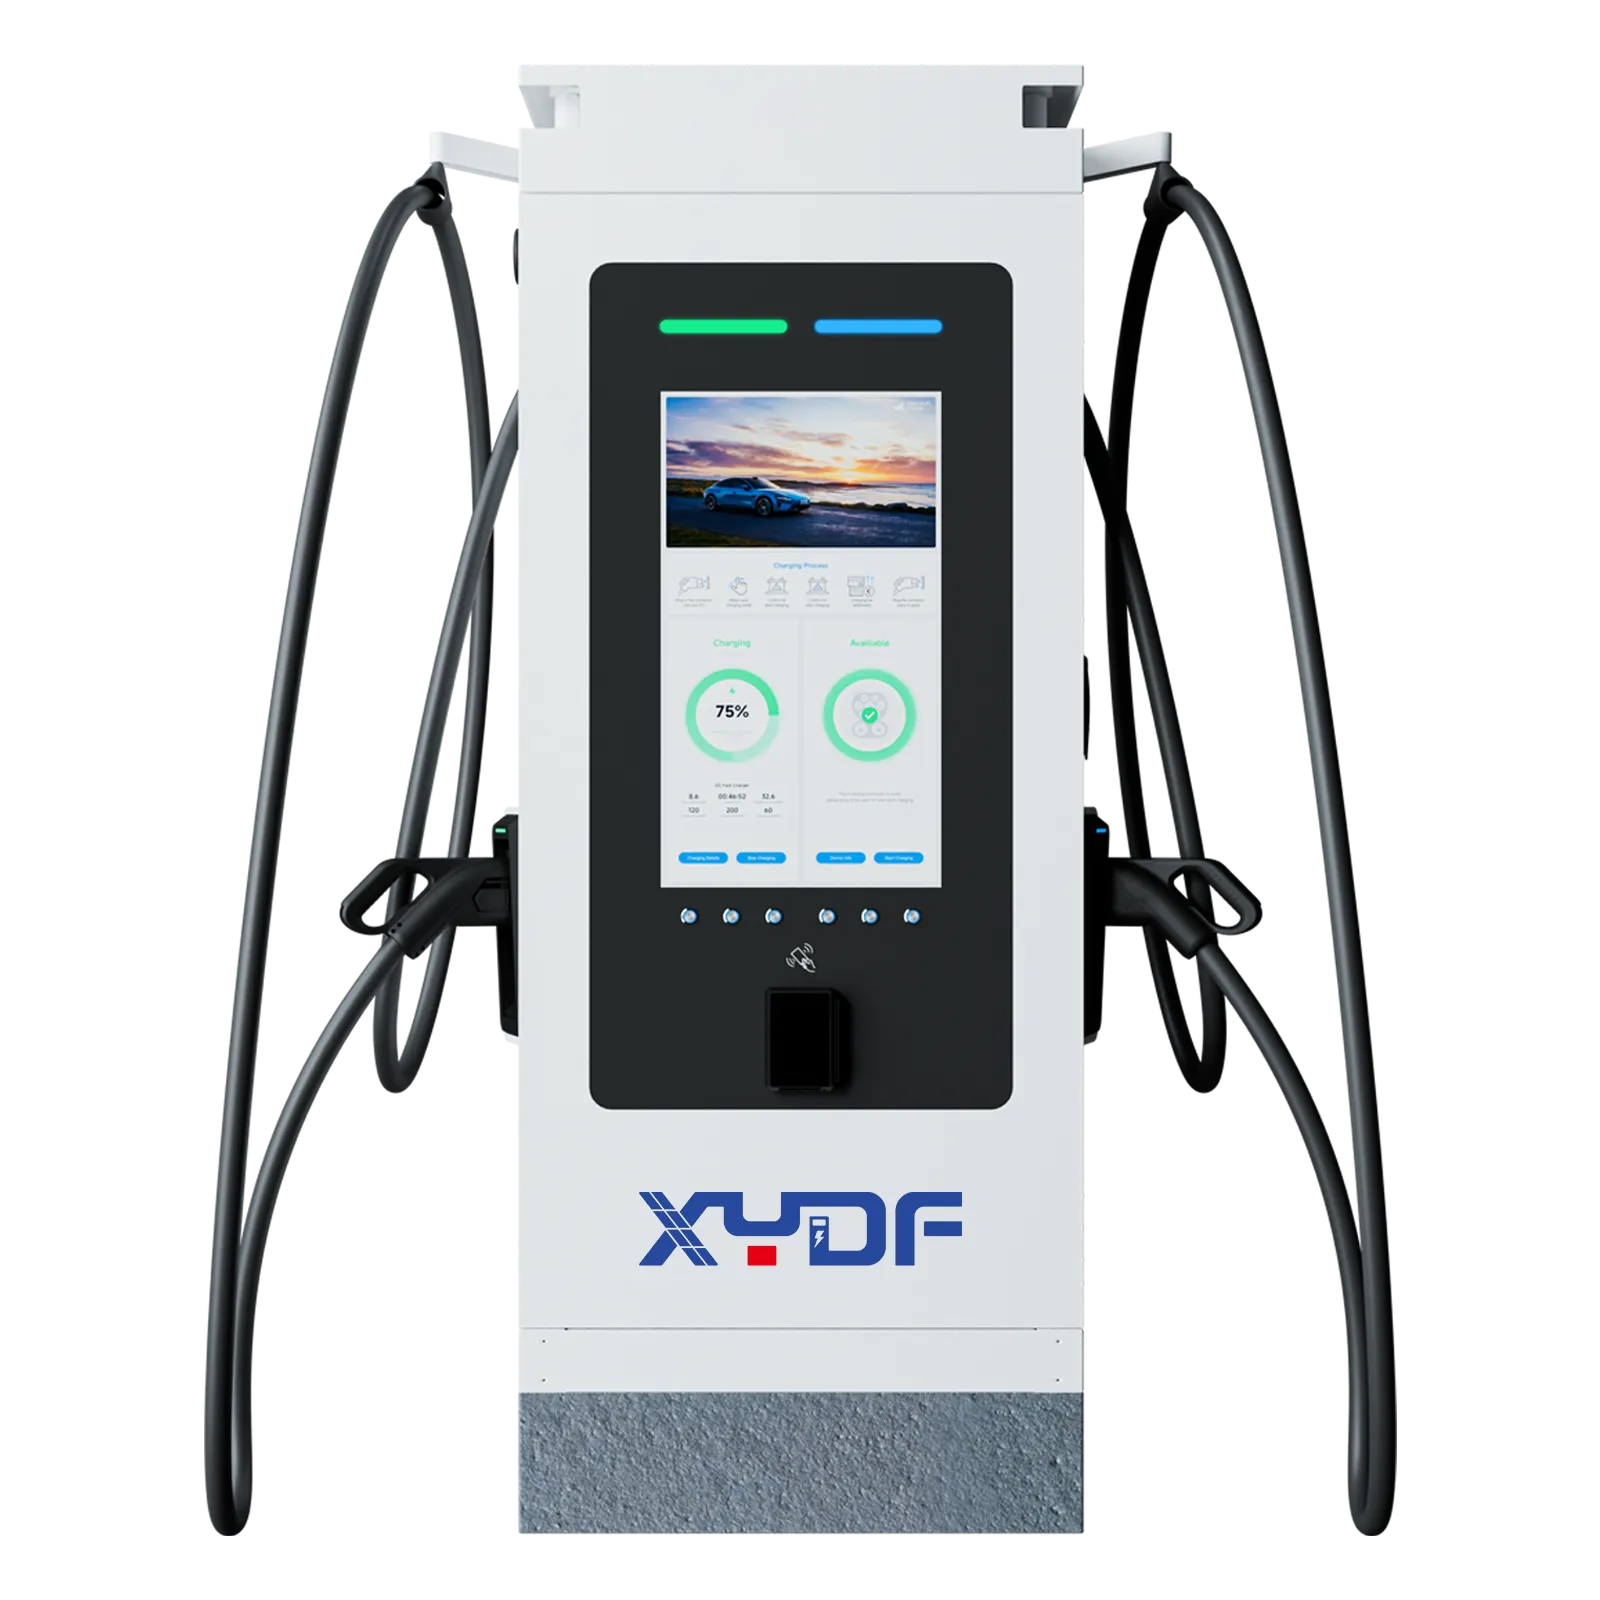
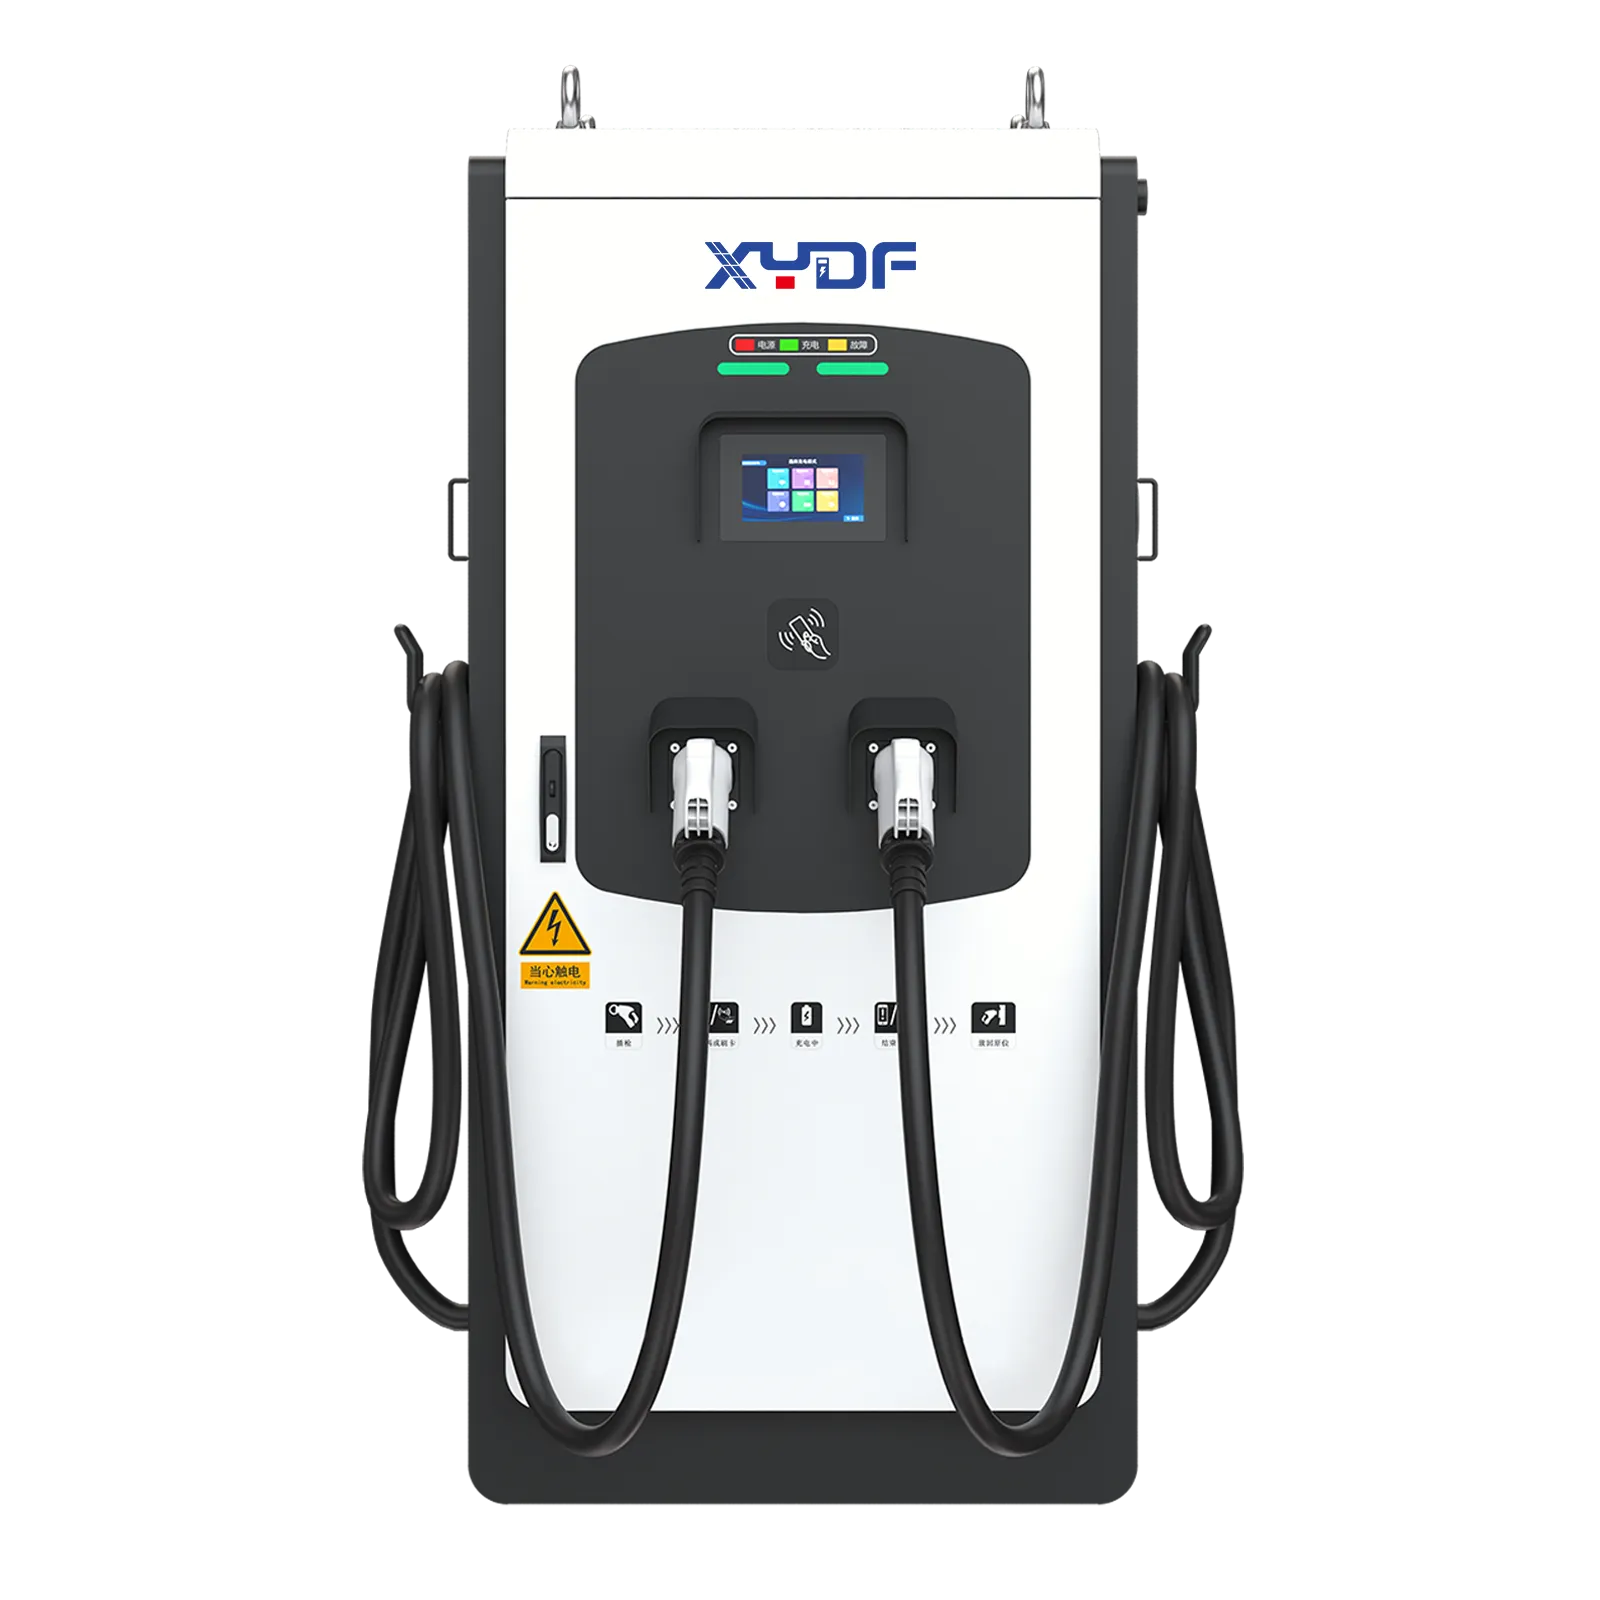
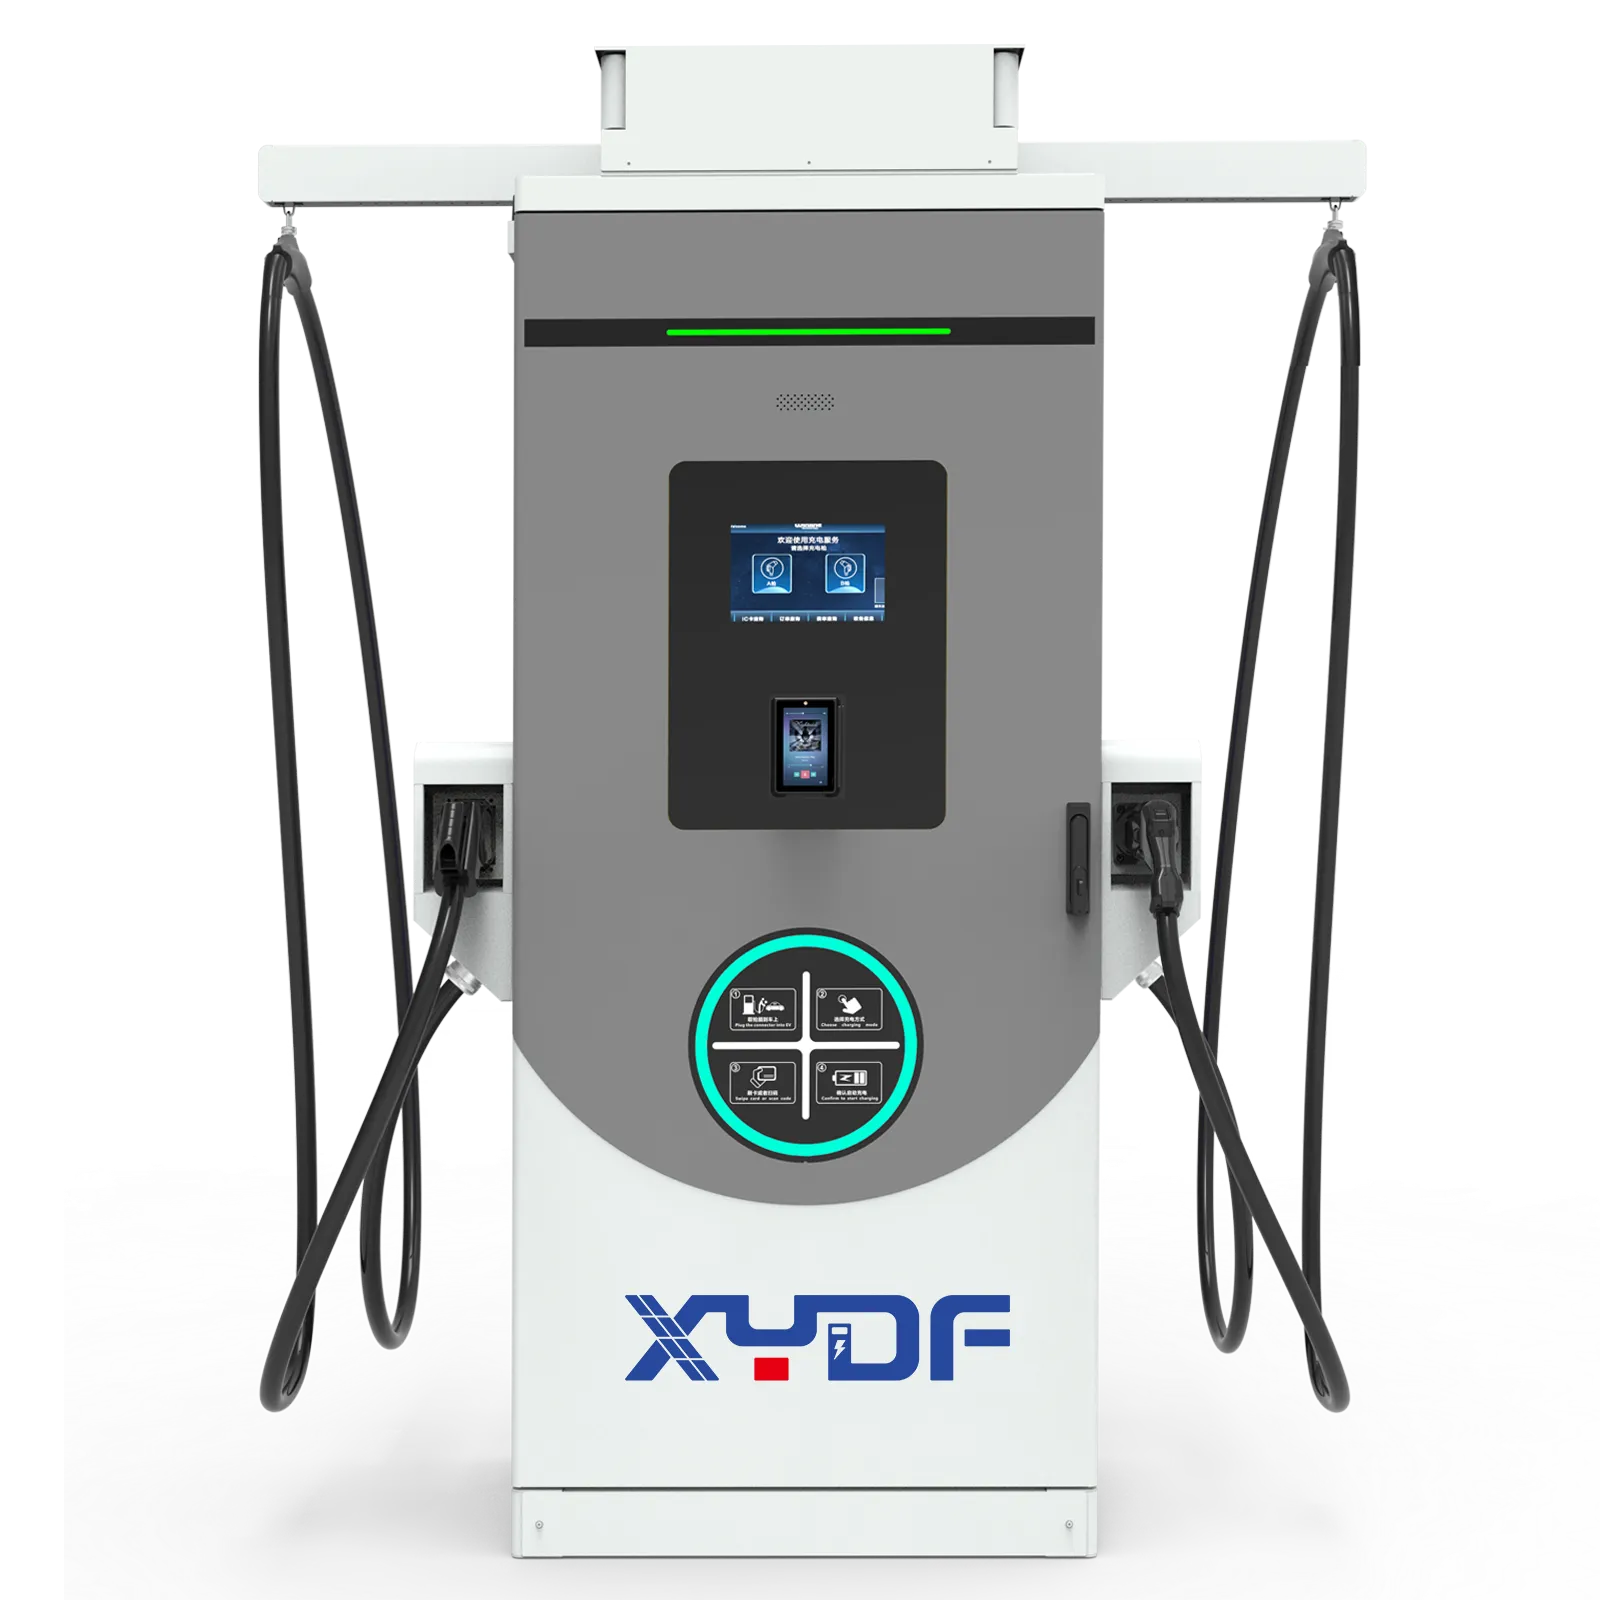
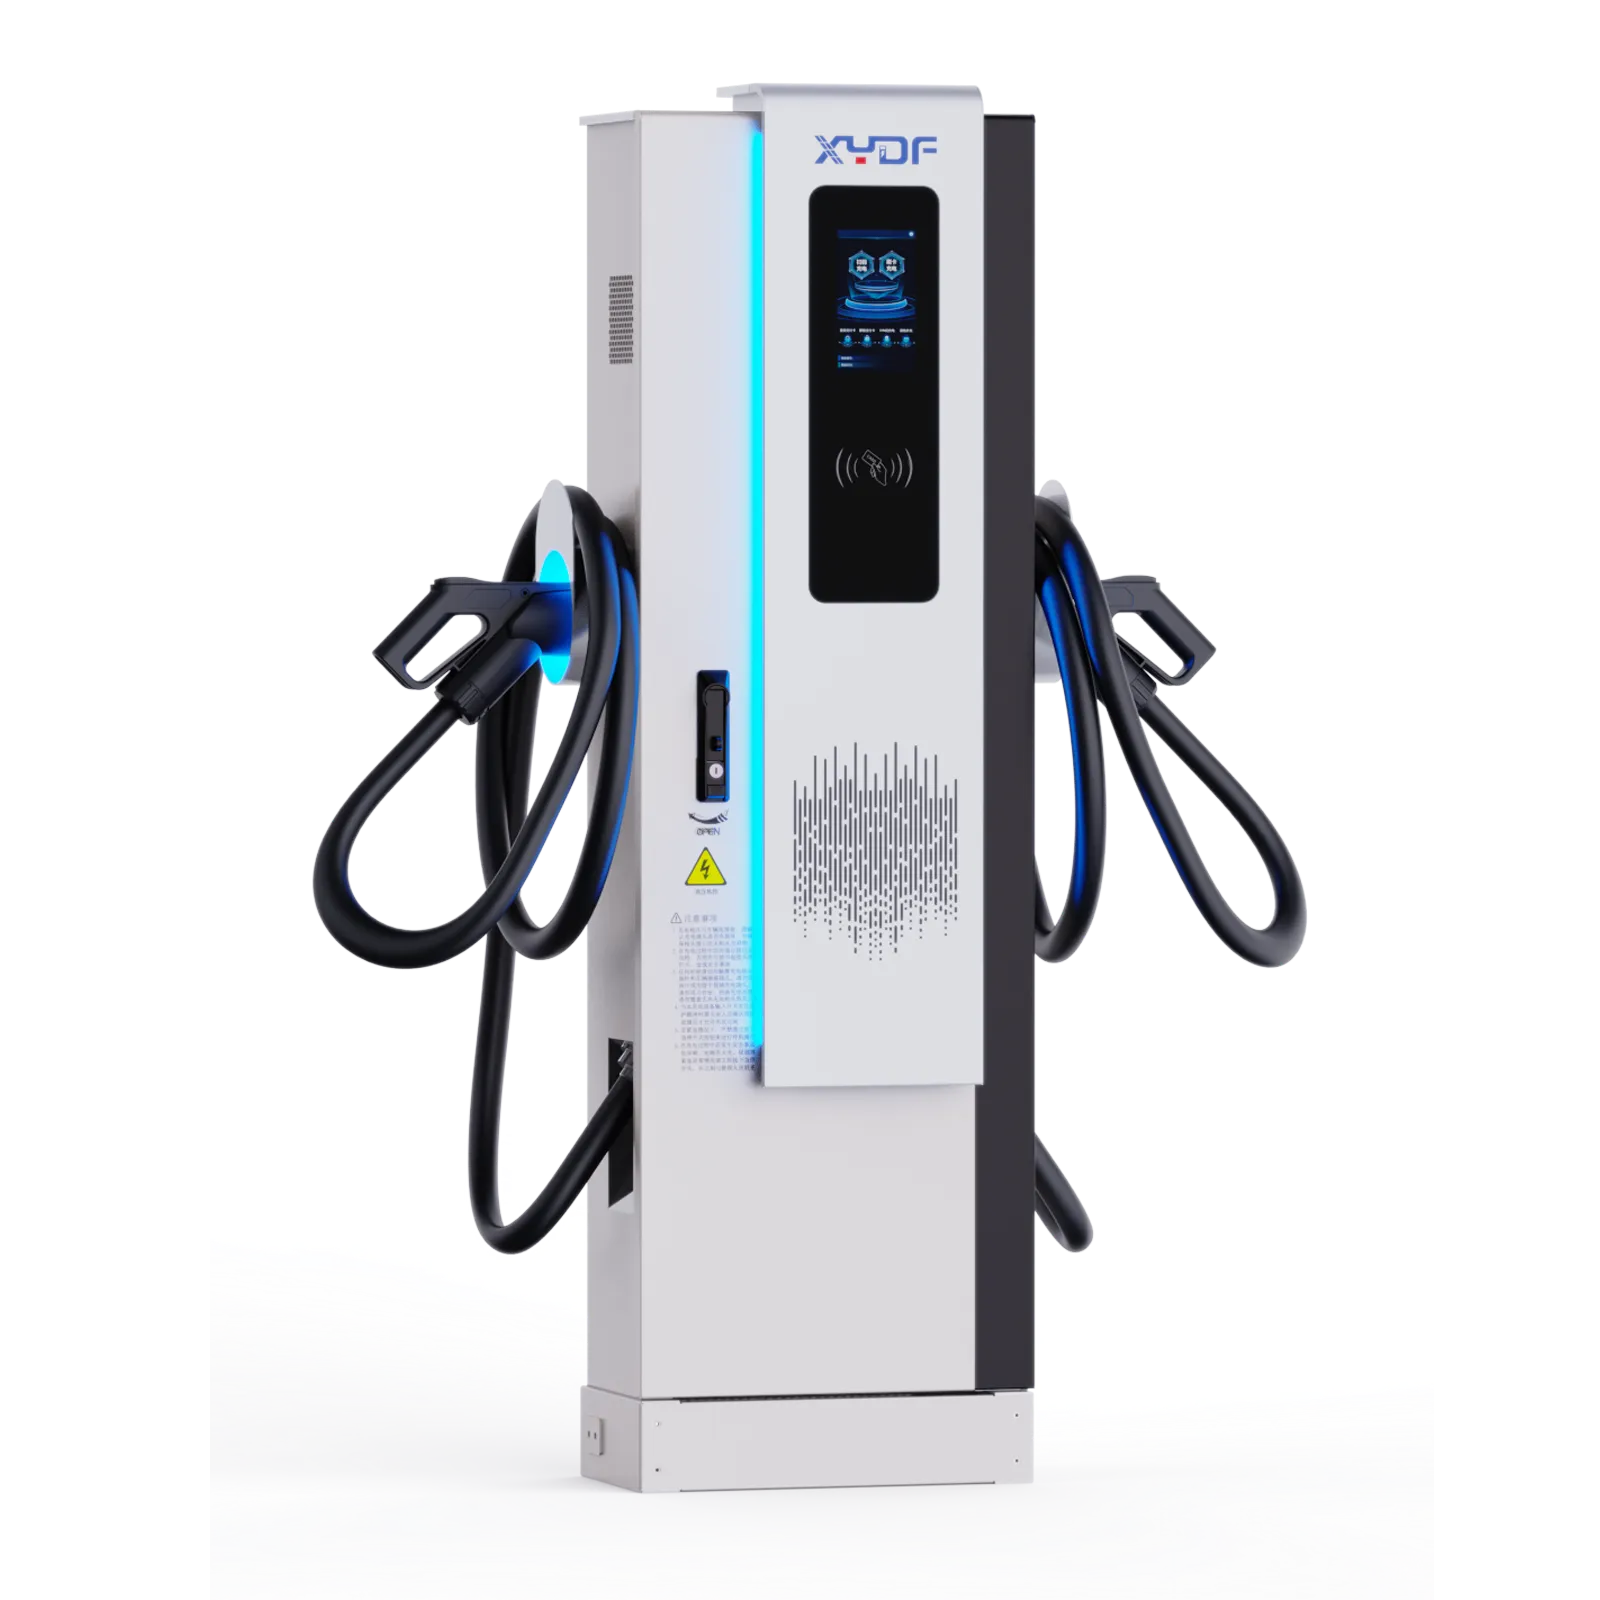
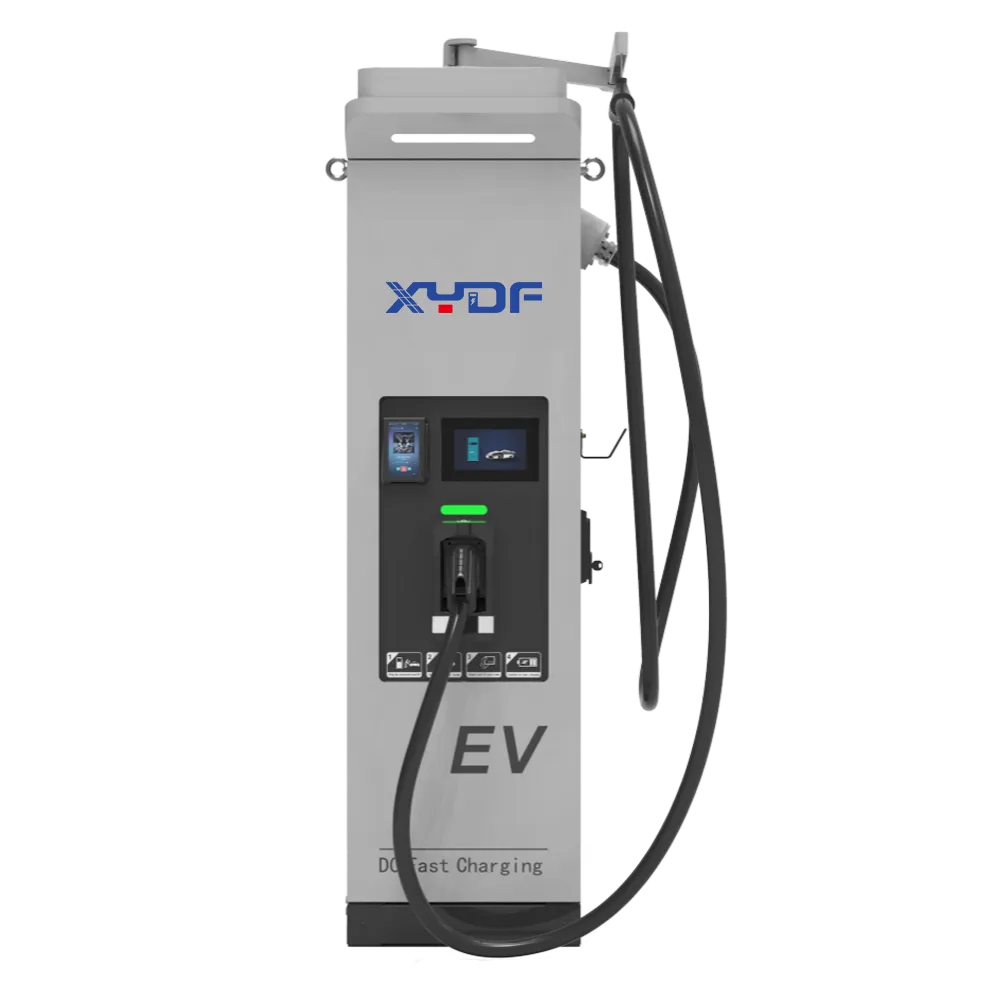
Partie 6. Quelles plateformes XYDF correspondent aux résultats des charges commerciales courantes ?
Part 7. When Should Measured Site Data, Utility Input, or Engineering Review Override the Initial Profile?
This guide supports commercial charger selection and electrical planning inputs. It does not replace:
Études d'interconnexion des services publics ou examens formels de l'impact sur le réseau
Dimensionnement des câbles, coordination des protections, ou plans de construction
Certification de réseau de paiement ou négociations tarifaires
Ingénierie du trafic ou conception de la circulation de stationnement
Modélisation de l'énergie des itinéraires de flottes pour les cycles de service des véhicules lourds
Si les données d'arrivée, la composition des véhicules ou les hypothèses de simultanéité sont inconnues, publiez une conception par étapes avec des points de surveillance plutôt que de verrouiller la puissance maximale dès le premier jour.
Which Site Findings Require the Load Model to Be Recalculated?
État
What to change in the model
Decision boundary
Fleet return times are synchronized
Use short intervals and a high-coincidence case
Do not rely on workplace diversity factors
Dwell time is below one hour
Test DC power, queue delay and connector turnover
Energy-per-session, not port count, sets adequacy
Utility capacity is binding
Model a hard site cap, load shedding and phase two
Obtain interconnection approval before procurement
Outdoor or hot-climate installation
Use manufacturer derating and thermal study inputs
Nameplate power is not guaranteed continuous output
Standards: scope before marketing language
Utiliser IEC 61851-1 for general conductive charging-system requirements and IEC 61851-23 for DC charging-system requirements. ISO 15118 addresses vehicle-to-grid communication; it is not a substitute for electrical installation approval. OCPP is an application protocol, not a safety certification. Product claims should name the market, edition and test scope; “supports OCPP” or “IEC compliant” without a documented scope can create tender, warranty and enforcement risk.
FAQ
Qu'est-ce que le profilage de la charge de recharge des VE commerciaux ?
Il s'agit du processus d'estimation de la demande de recharge qui se produit, du nombre de sessions qui se chevauchent et de la puissance que le site doit fournir tout au long de la journée.
Quelles données doivent être collectées en premier ?
Définir groupe d'utilisateurs, temps de séjour, parc de véhicules, état de charge à l'arrivée, heures d'ouverture et horizon réaliste d'adoption des véhicules électriques avant de calculer la puissance (kW).
Comment la charge simultanée diffère-t-elle de la puissance totale installée ?
La puissance installée est la somme des plaques signalétiques des chargeurs. La charge simultanée est la puissance réellement tirée en même temps — généralement inférieure, sauf dans les dépôts de flotte.
Les lieux de travail devraient-ils opter par défaut pour les chargeurs AC ?
Les lieux de travail de longue durée commencent souvent par une forte demande de climatisation car les véhicules restent garés assez longtemps pour restituer une énergie utile à une puissance par borne plus faible.
Comment les frais de demande affectent-ils la conception des chargeurs ?
If tariffs apply demand charges to peak demand, the profile should identify whether software load management can cap site kW without harming user experience.
Quand le déploiement par étapes est-il préférable à un déploiement complet ?
Lorsque les prévisions d'adoption sont incertaines ou que la capacité du réseau est limitée. Mettre en place des ports de scène, la surveillance et la capacité d'alimentation pour une seconde phase.
Que faut-il envoyer à un fabricant de chargeurs pour VE ?
Envoyez la courbe de demande, les hypothèses de diversité, les normes de connecteur cibles, les exigences OCPP/backend et la capacité kW du site afin que le fournisseur puisse proposer un mélange AC/DC et une gestion de la charge.
What interval should a commercial charging load profile use?
Use the utility’s actual billing-demand interval for cost exposure, then retain finer telemetry for control and queue analysis. If the tariff is unknown, run both a 15-minute planning case and a finer operational case, and label the assumption for the utility to confirm.
How much transformer headroom is enough?
There is no universal percentage. Headroom depends on existing non-EV load, ambient conditions, protection settings, harmonics and the utility’s study; the electrical engineer should document the governing limit rather than copy a generic reserve factor.
Can software load management replace a grid upgrade?
It can reduce coincident demand when vehicles have flexible departure times, but it cannot create energy or remove a sustained capacity deficit. Validate meter response, fail-safe behavior and user-priority rules before treating a software cap as an interconnection solution.
Which commissioning metrics should be checked first?
Track interval peak kW, coincidence, kWh per session, plug-in-to-start delay and sessions missing their departure target for at least one representative operating cycle. Use those observations to release staged capacity, not to retroactively justify an unsupported design assumption.
For a documented equipment shortlist, compare the Gamma de chargeurs AC avec Catégorie des chargeurs rapides DC only after the profile and site cap are agreed; the broader Catalogue de produits can then be matched to the approved duty cycle. The honest commercial EV charging load profiling rule is simple: measure the constraint, state the assumption, and stage the irreversible spend.
\n
A second commercial EV charging load profiling pass should test the utility billing interval against a synchronized fleet-return case before equipment quantities are frozen.
\n
When tariff data is incomplete, mark the commercial EV charging load profiling result as provisional and schedule a meter-data refresh before phase-two capacity is released.
\n
Quels données devrait inclure un modèle de capacité de recharge commerciale pour les véhicules électriques ?
Un modèle de capacité utile combine l’énergie du véhicule en fonction du cycle de charge, des fenêtres d’arrivée et de départ, de la charge simultanée, du partage de la puissance du chargeur, des limites électriques du site, des intervalles tarifaires et une réserve pour les sessions tardives ou échouées. Le modèle doit indiquer les hypothèses et le point de mesure de l’acceptabilité afin que les acheteurs puissent comparer les propositions sans considérer une valeur kW figurant sur le tableau d’affichage comme capacité de service garantie.
Usine du siège social du Zhejiang :
N° 2, route de Changjiang, parc industriel du pont de Wenzhou, ville de beibaixiang, ville de Yueqing, ville de Wenzhou, province du Zhejiang
Bureau de Shenzhen :
1er étage, Bâtiment A, Parc Industriel Shenkai, Communauté Tangtou, Sous-district de Shiyan, District de Bao'an, Shenzhen
Nous utilisons des cookies pour assurer le bon fonctionnement de ce site Web et, avec votre autorisation, pour mesurer la manière dont les visiteurs utilisent notre site de recharge pour VE. Voir notre Politique de confidentialité pour plus de détails.
 Xinya Dongfang Electricity Technology Co., Ltd.